Dans cet article, on va mettre en place une stack ELK pour centraliser et visualiser des logs réseau. On va connecter Snort et Suricata comme sources, et récupérer les logs d’une machine Windows avec Winlogbeat.
L’ELK Stack, c’est trois outils qui travaillent ensemble : Elasticsearch pour l’indexation et la recherche, Logstash pour la collecte et la transformation des logs, et Kibana pour la visualisation. C’est une solution classique pour avoir une vue centralisée sur ce qui se passe sur un réseau.
On utilise Vagrant pour provisionner la machine. L’avantage c’est qu’on décrit l’infrastructure en code — si on doit tout reconstruire, on relance juste vagrant up.
Vagrant.configure("2") do |config| config.vm.box = "ubuntu/jammy64"
config.vm.network "private_network", ip: "192.168.56.10" config.vm.network "public_network", bridge: "wlan0", ip: "192.168.1.70"
config.vm.synced_folder ".", "/vagrant", disabled: false config.vm.synced_folder "./pipelines", "/etc/logstash/conf.d", disabled: false
config.vm.provider "virtualbox" do |vb| vb.gui = false vb.memory = "5192" end
config.vm.provision "shell", inline: <<-SHELL
apt-get update
# Ajout du dépôt Elastic wget -qO - https://artifacts.elastic.co/GPG-KEY-elasticsearch | sudo gpg --dearmor -o /usr/share/keyrings/elasticsearch-keyring.gpg sudo apt-get install -y apt-transport-https echo "deb [signed-by=/usr/share/keyrings/elasticsearch-keyring.gpg] https://artifacts.elastic.co/packages/8.x/apt stable main" | sudo tee /etc/apt/sources.list.d/elastic-8.x.list sudo apt-get update
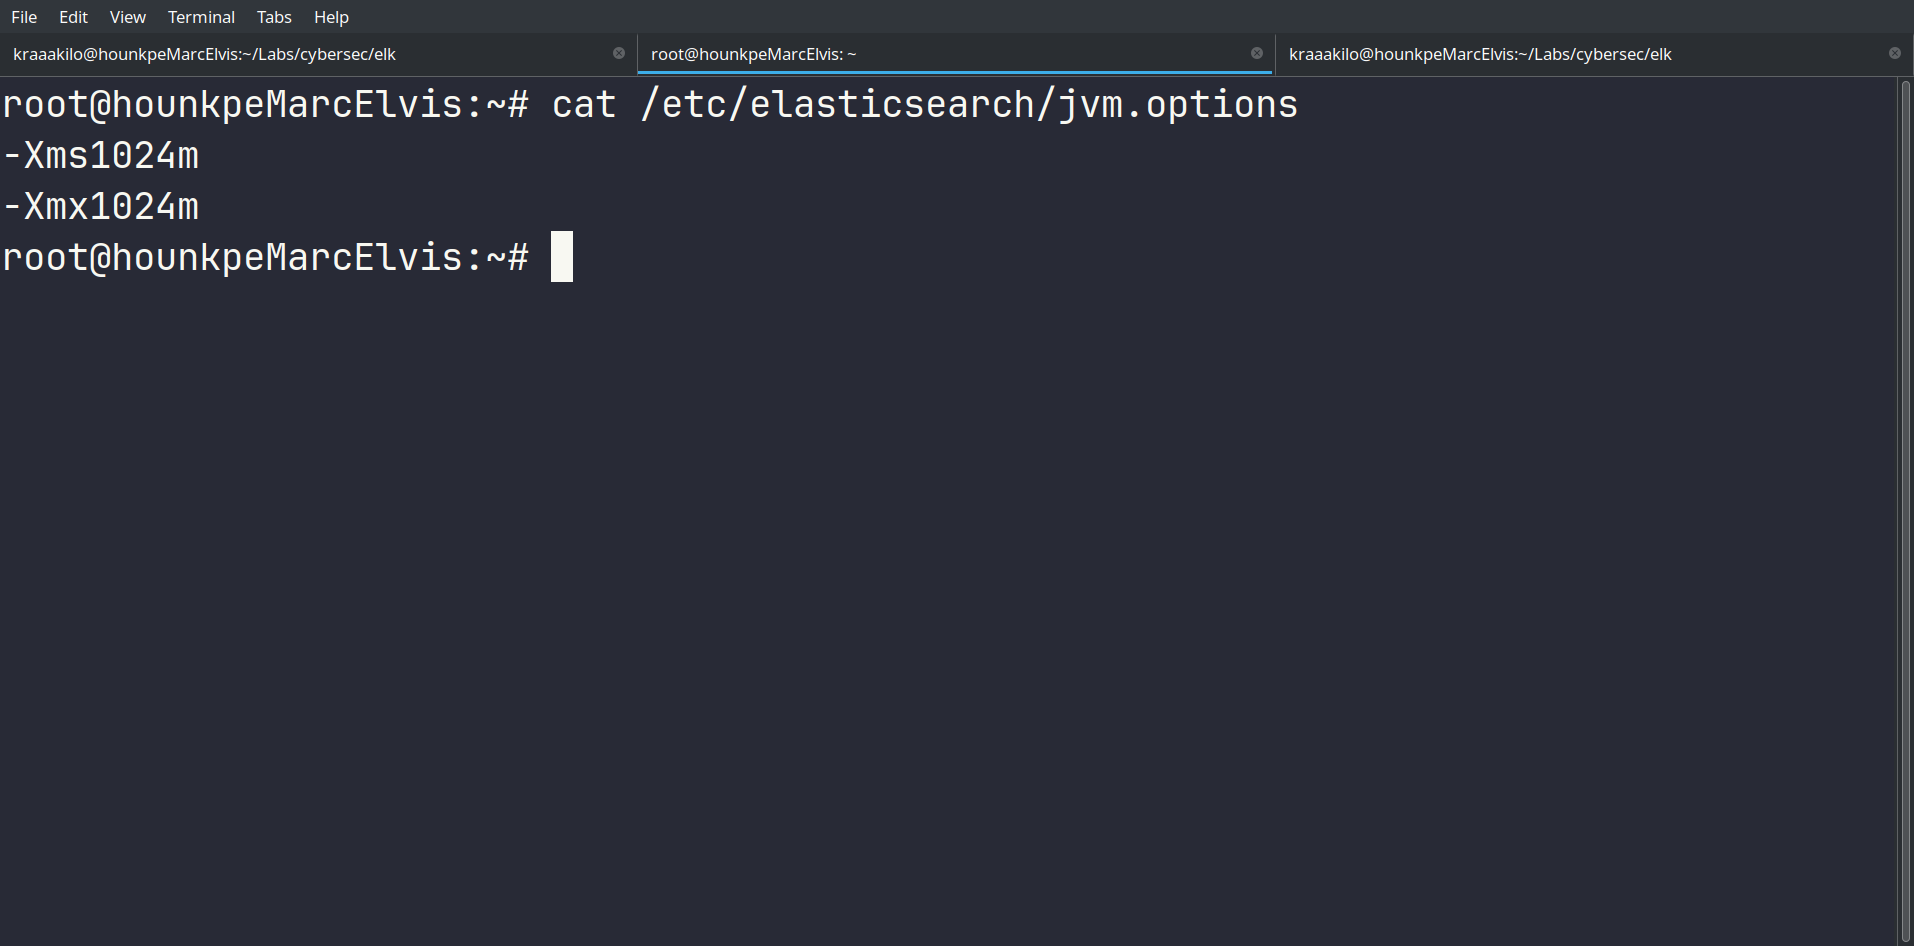
# Elasticsearch sudo apt-get install -y elasticsearch sudo echo "-Xms1024m" > /etc/elasticsearch/jvm.options sudo echo "-Xmx1024m" >> /etc/elasticsearch/jvm.options sudo systemctl enable --now elasticsearch sudo systemctl restart elasticsearch
# Kibana sudo apt-get install -y kibana sudo echo "-Xms512m" > /etc/kibana/jvm.options sudo echo "-Xmx512m" >> /etc/kibana/jvm.options sudo systemctl enable --now kibana sudo systemctl restart kibana sed -i 's|#server.host: "localhost"|server.host: "0.0.0.0"|g' /etc/kibana/kibana.yml sed -i 's|#server.port: 5601|server.port: 5601|g' /etc/kibana/kibana.yml
# Logstash sudo apt-get install -y logstash sudo echo "-Xms1g" > /etc/logstash/jvm.options sudo echo "-Xmx1g" >> /etc/logstash/jvm.options sudo systemctl enable --now logstash sudo systemctl restart logstash
SHELLendLe dossier ./pipelines est synchronisé avec /etc/logstash/conf.d sur la VM — on édite les pipelines localement et les changements sont directement pris en compte.
On initialise et on se connecte :
vagrant upvagrant ssh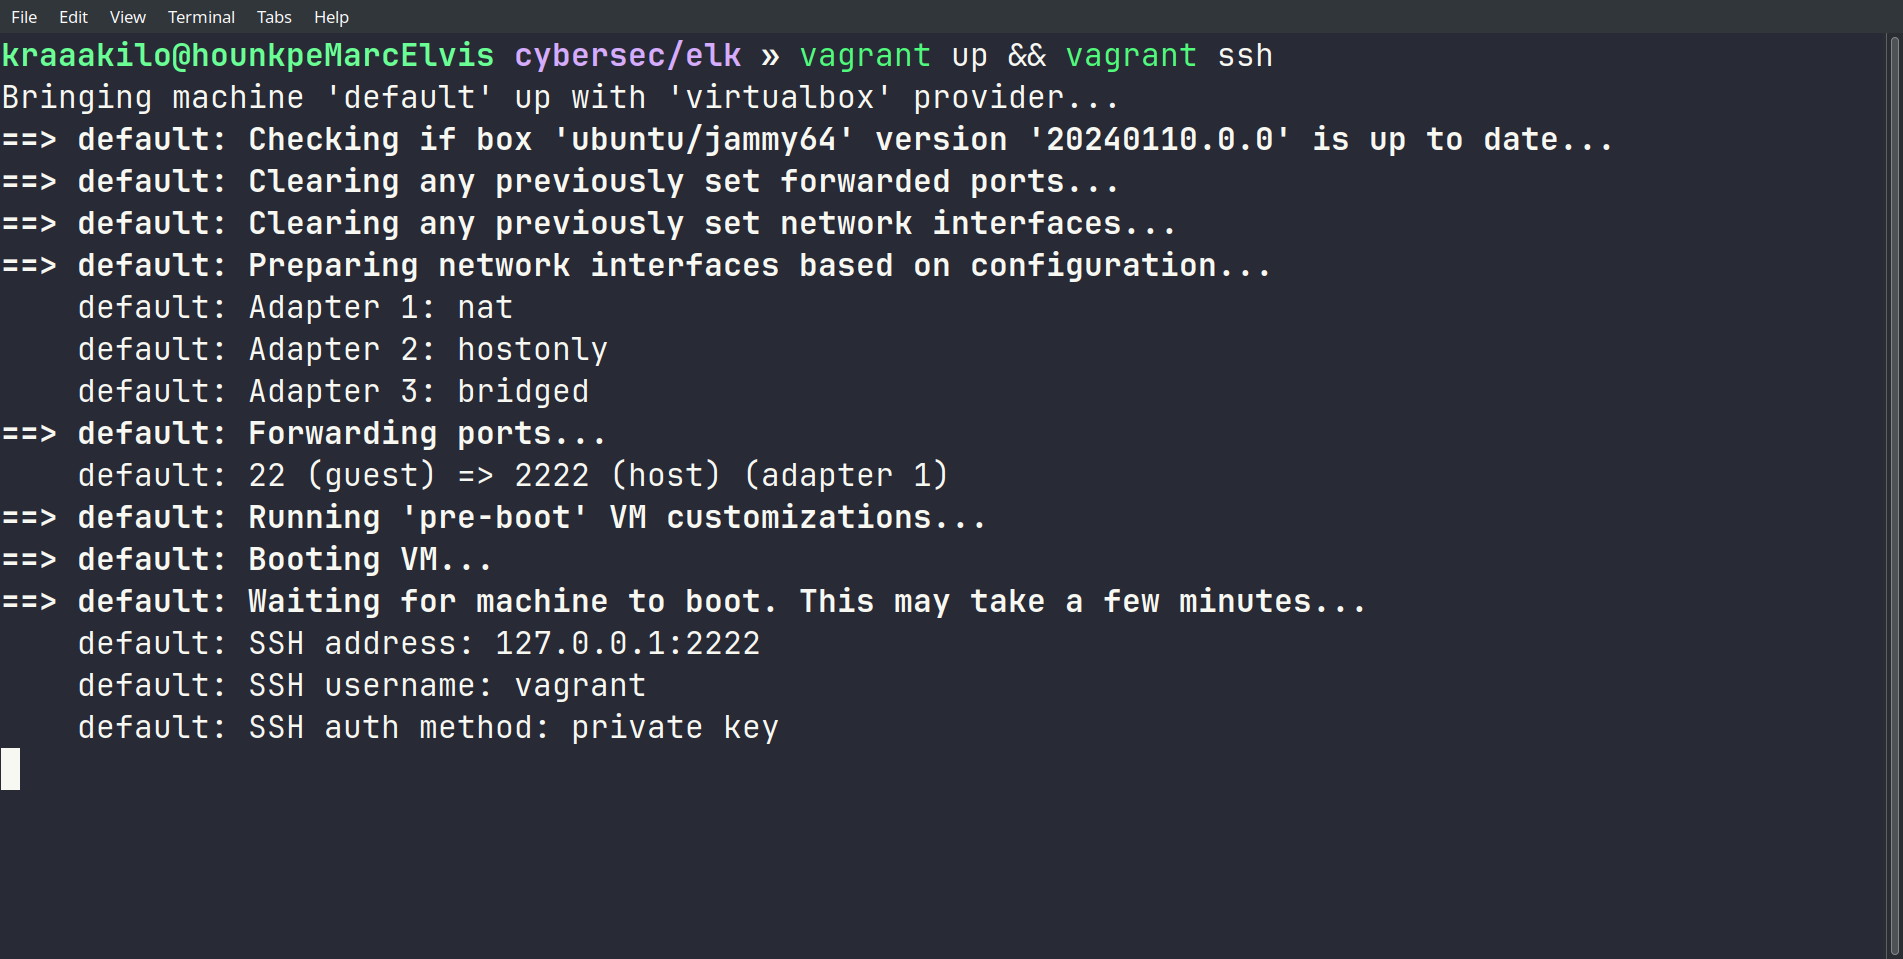
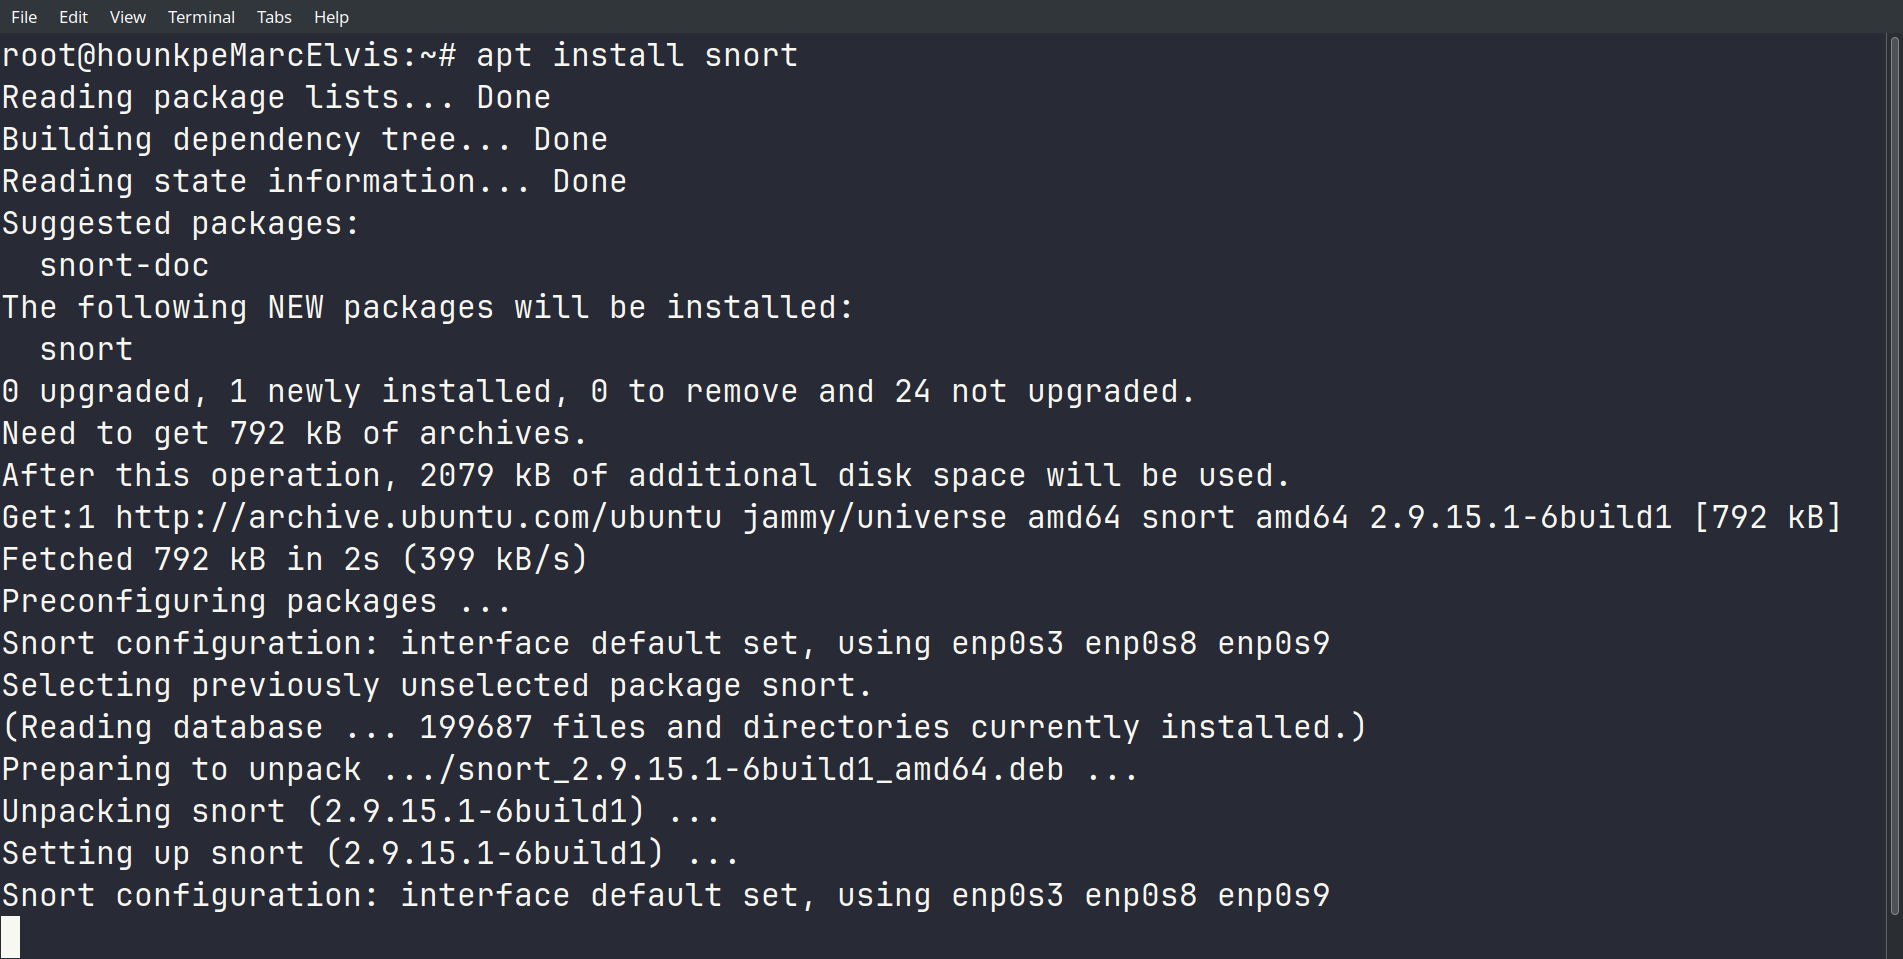
Une fois Snort installé, on passe par le shell interactif pour le configurer.
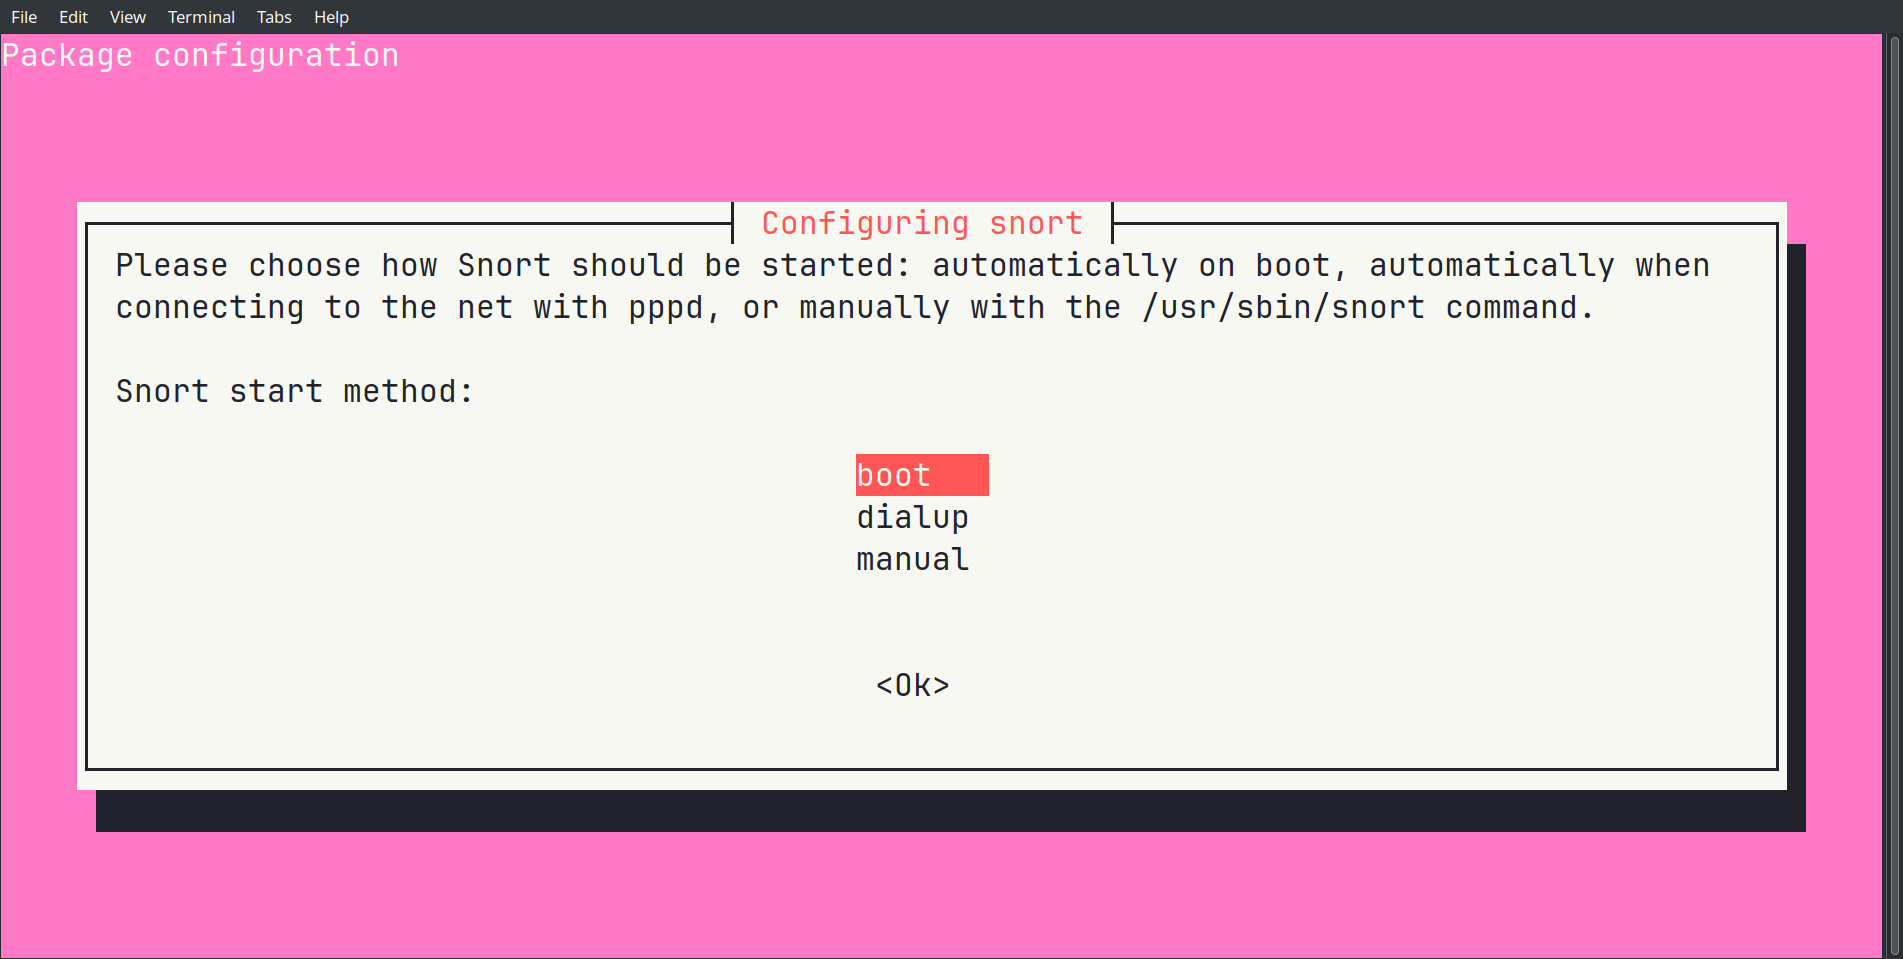
On choisit de démarrer Snort automatiquement au boot, pour ne pas avoir à relancer le service manuellement.
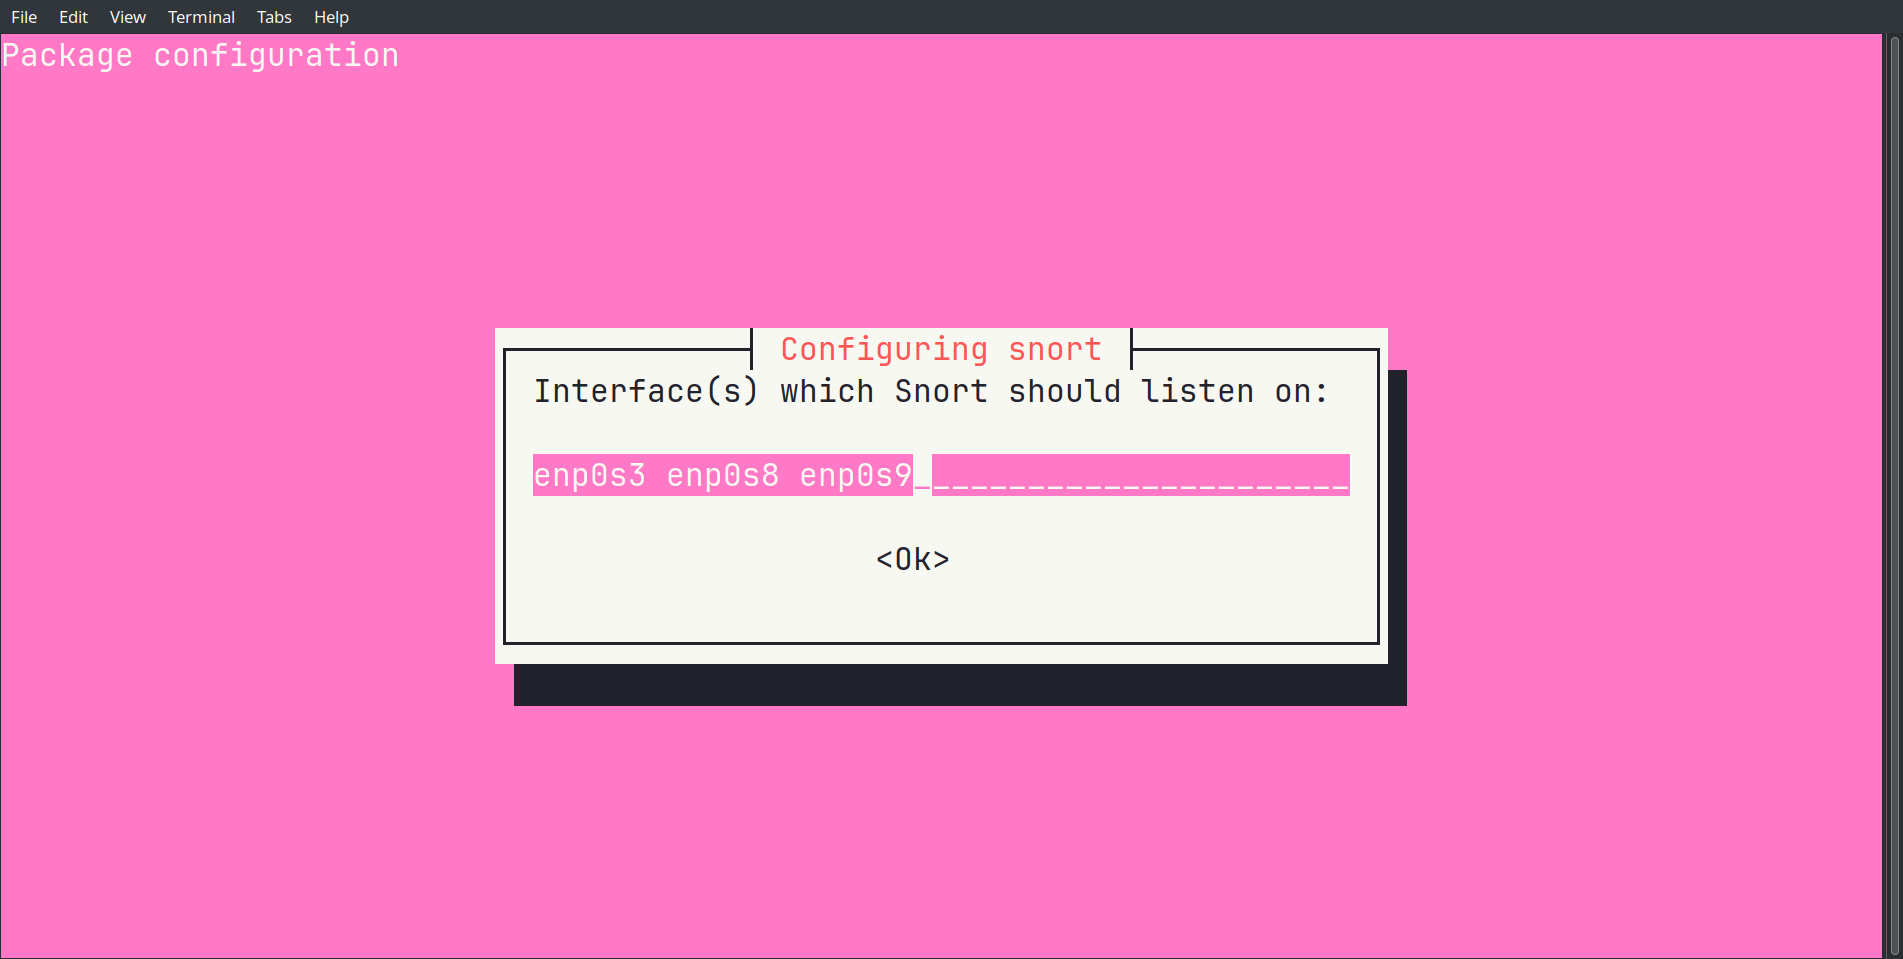
On sélectionne ensuite les interfaces réseau sur lesquelles Snort doit écouter — ici on prend les trois interfaces disponibles pour couvrir tout le trafic pertinent.
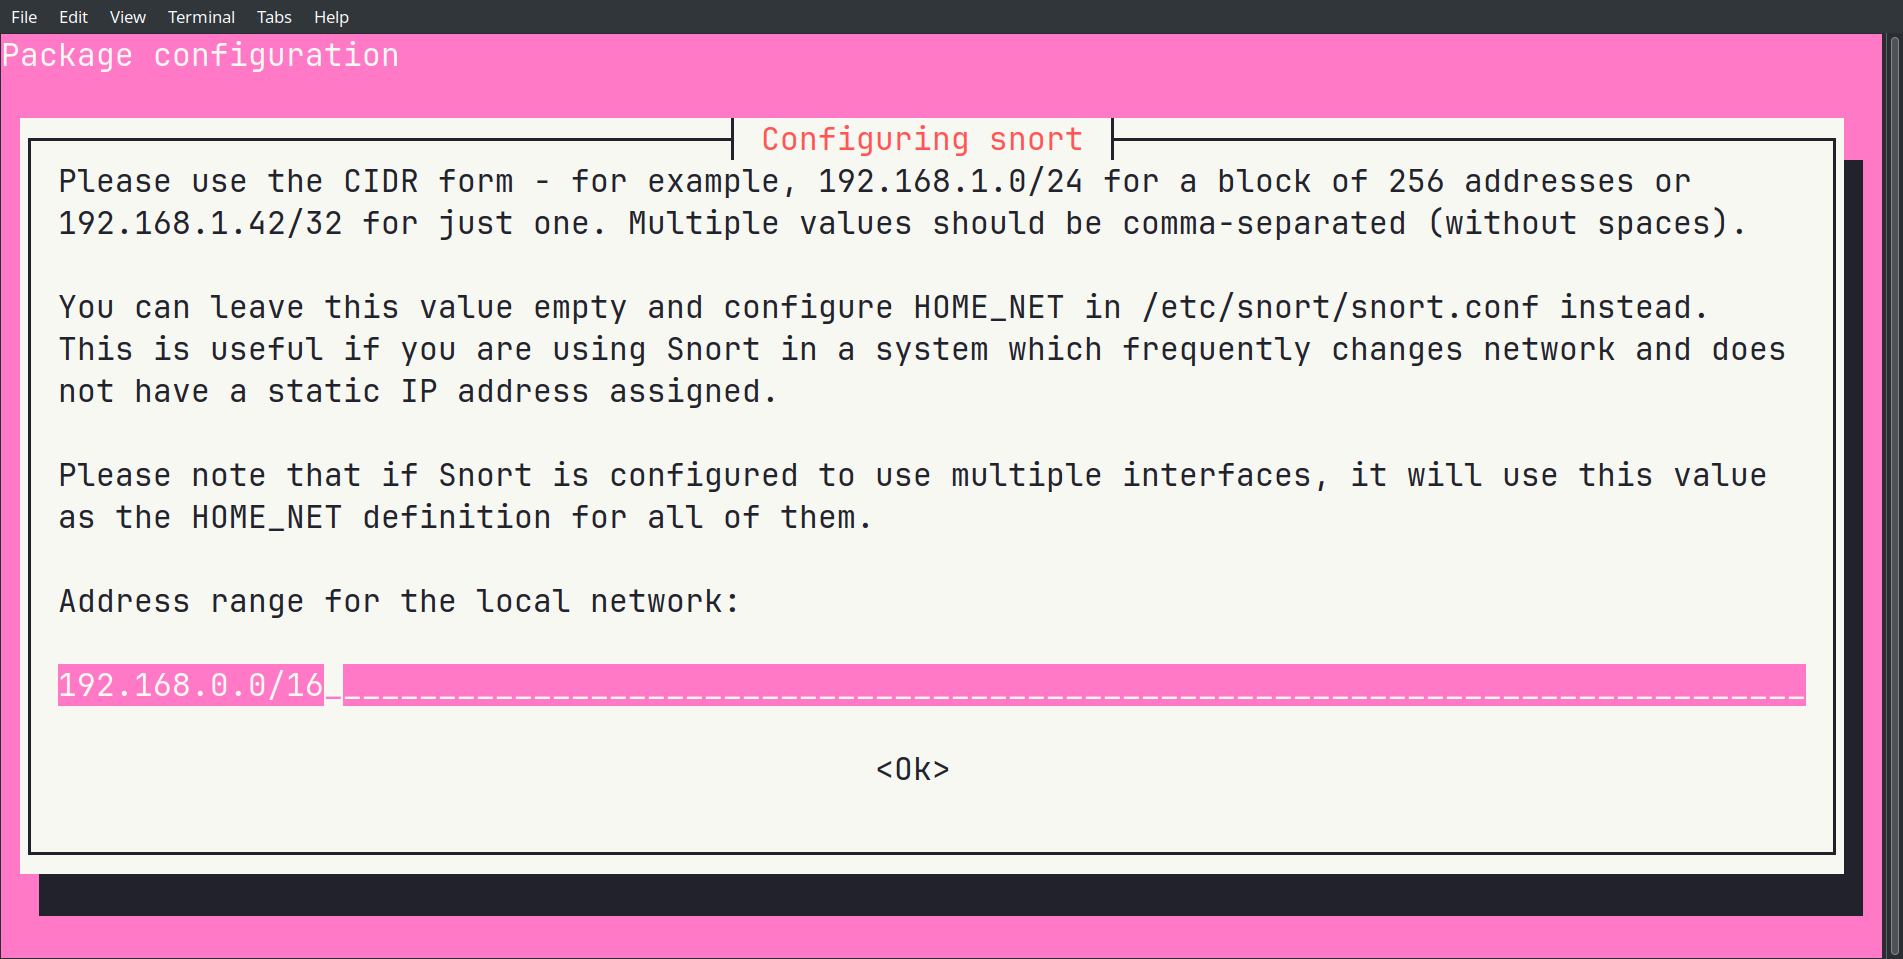
On configure la plage d’adresses en notation CIDR. On choisit 192.168.0.0/16 pour couvrir l’ensemble du réseau local.
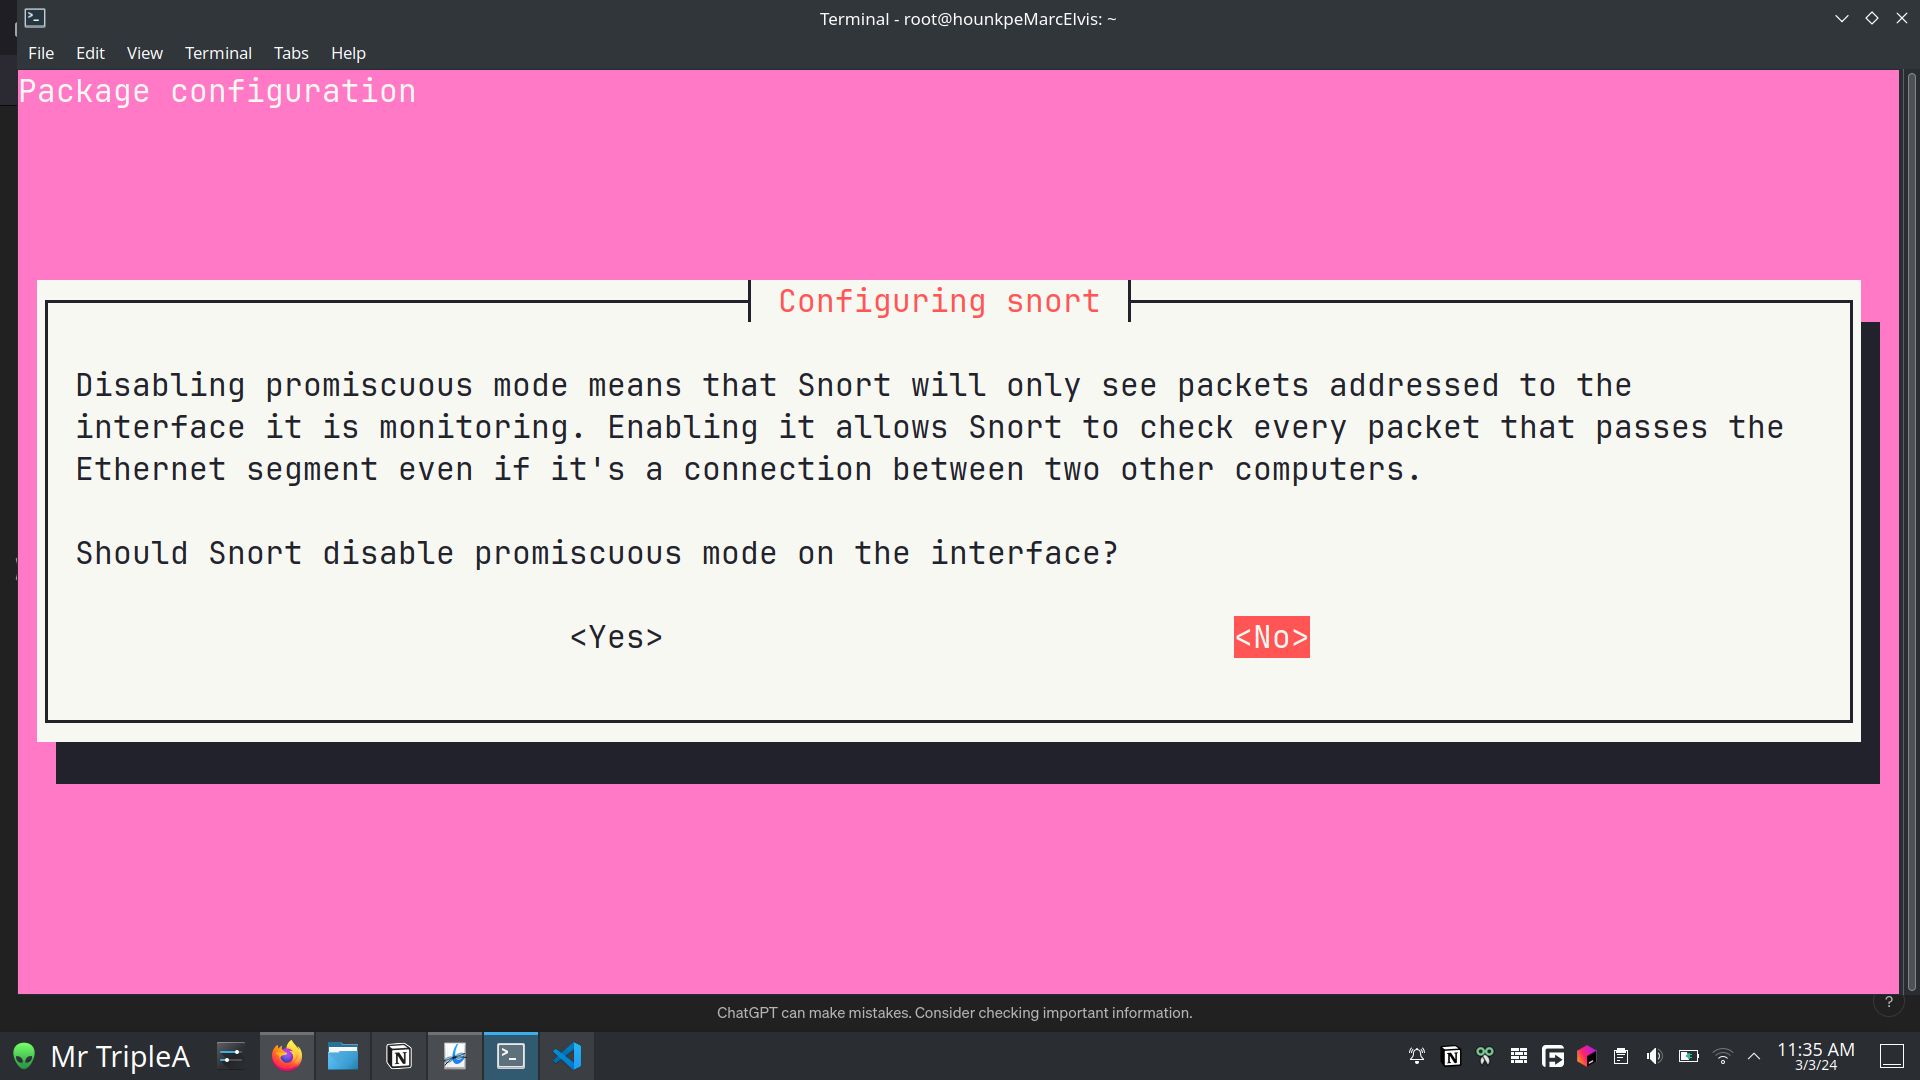
On active le mode promiscuous — ça permet à Snort de capturer tout le trafic sur le segment réseau, pas seulement les paquets qui lui sont destinés.
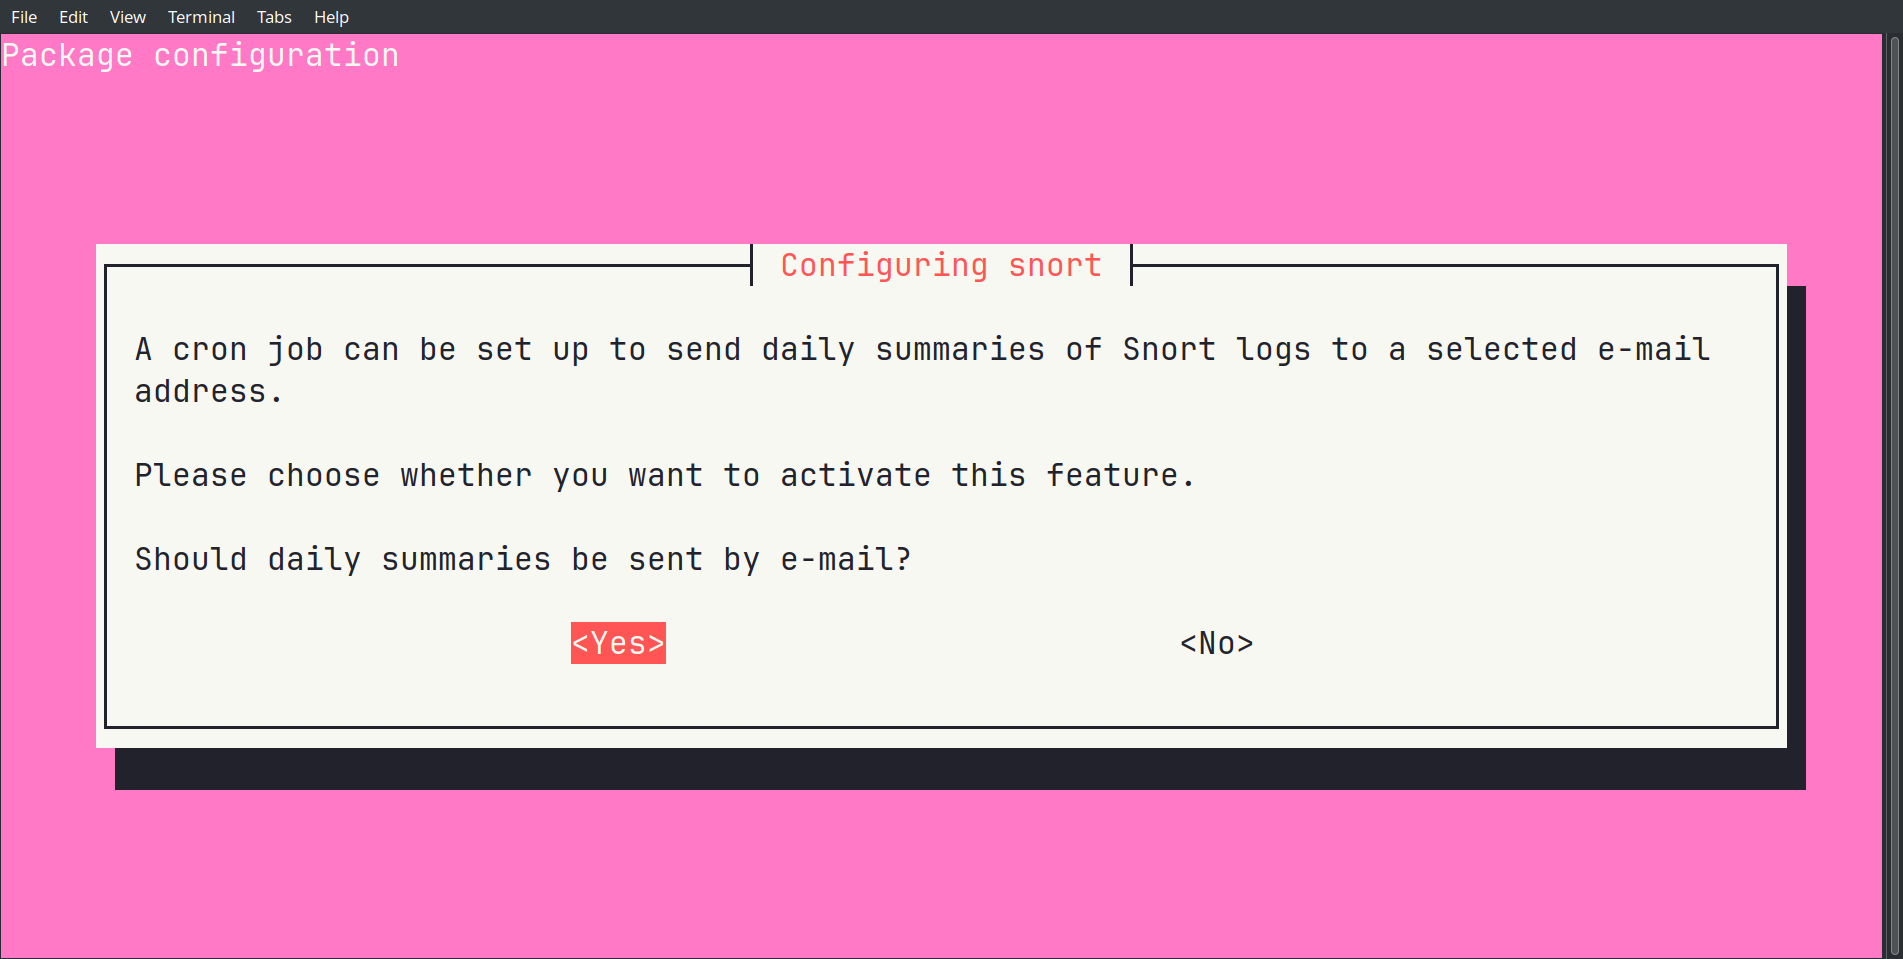
On désactive l’envoi d’emails pour les logs — on va tout gérer via Kibana et Elasticsearch.
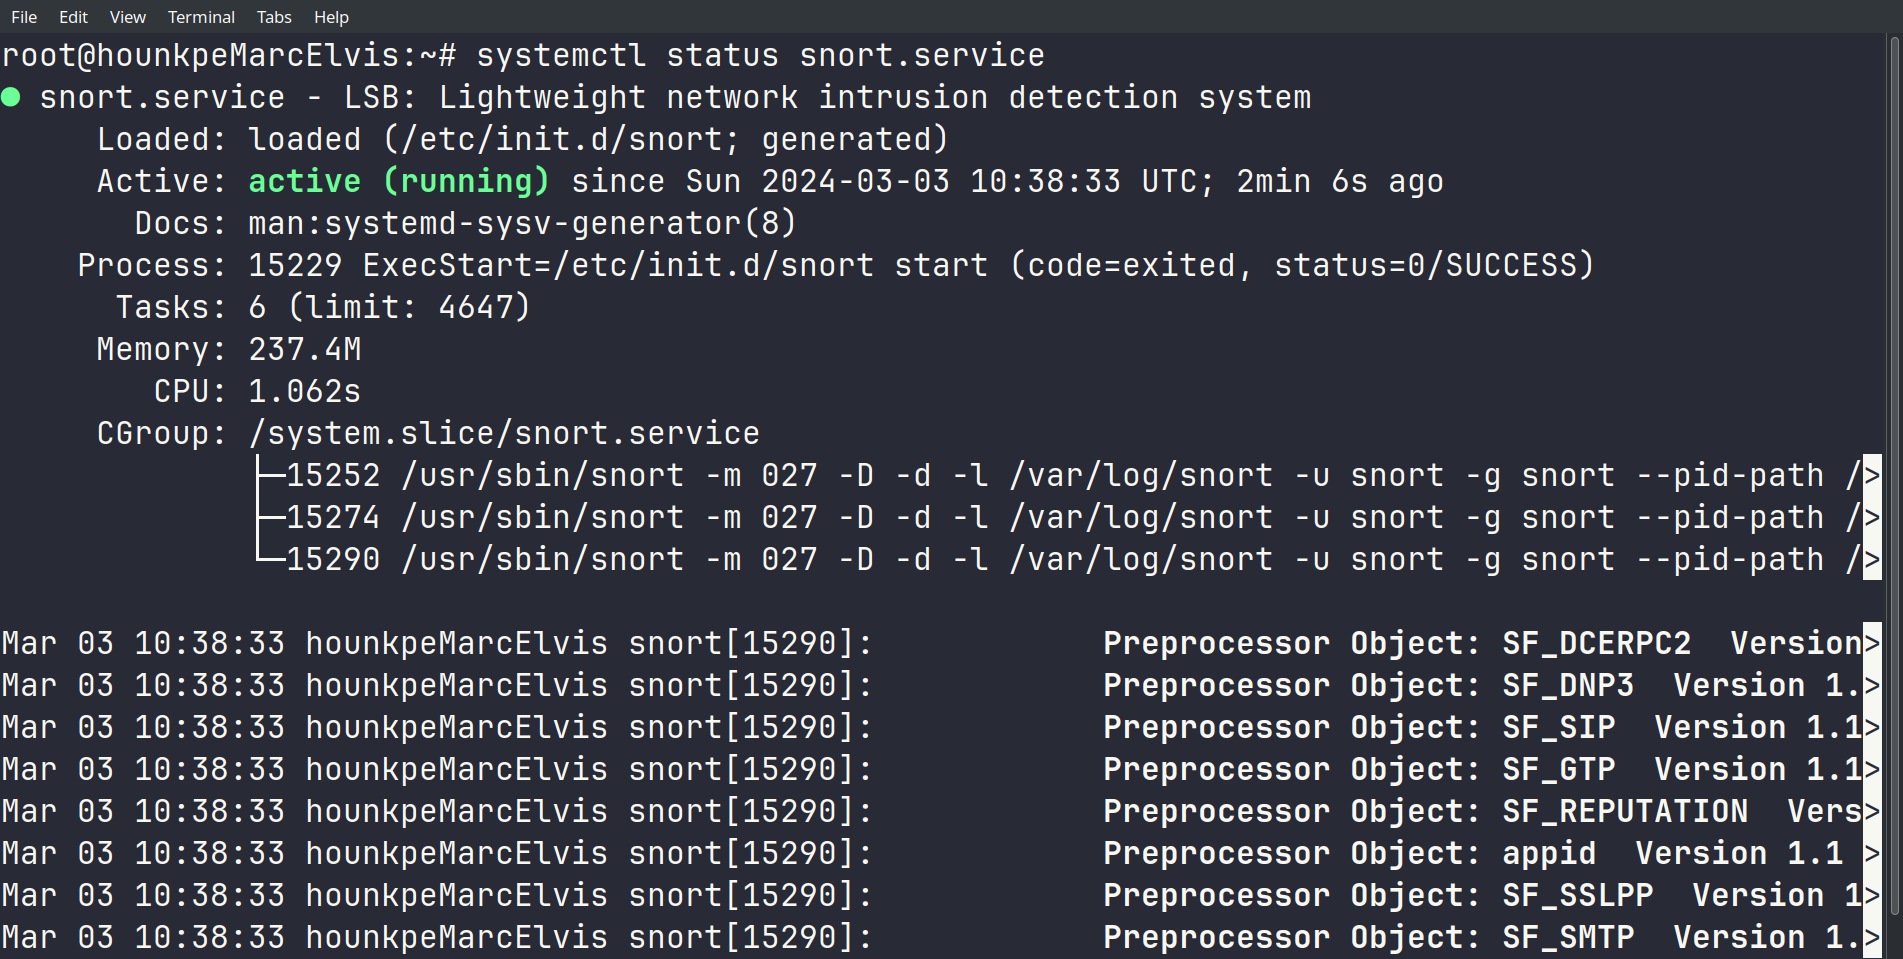
Snort tourne. On vérifie son statut :
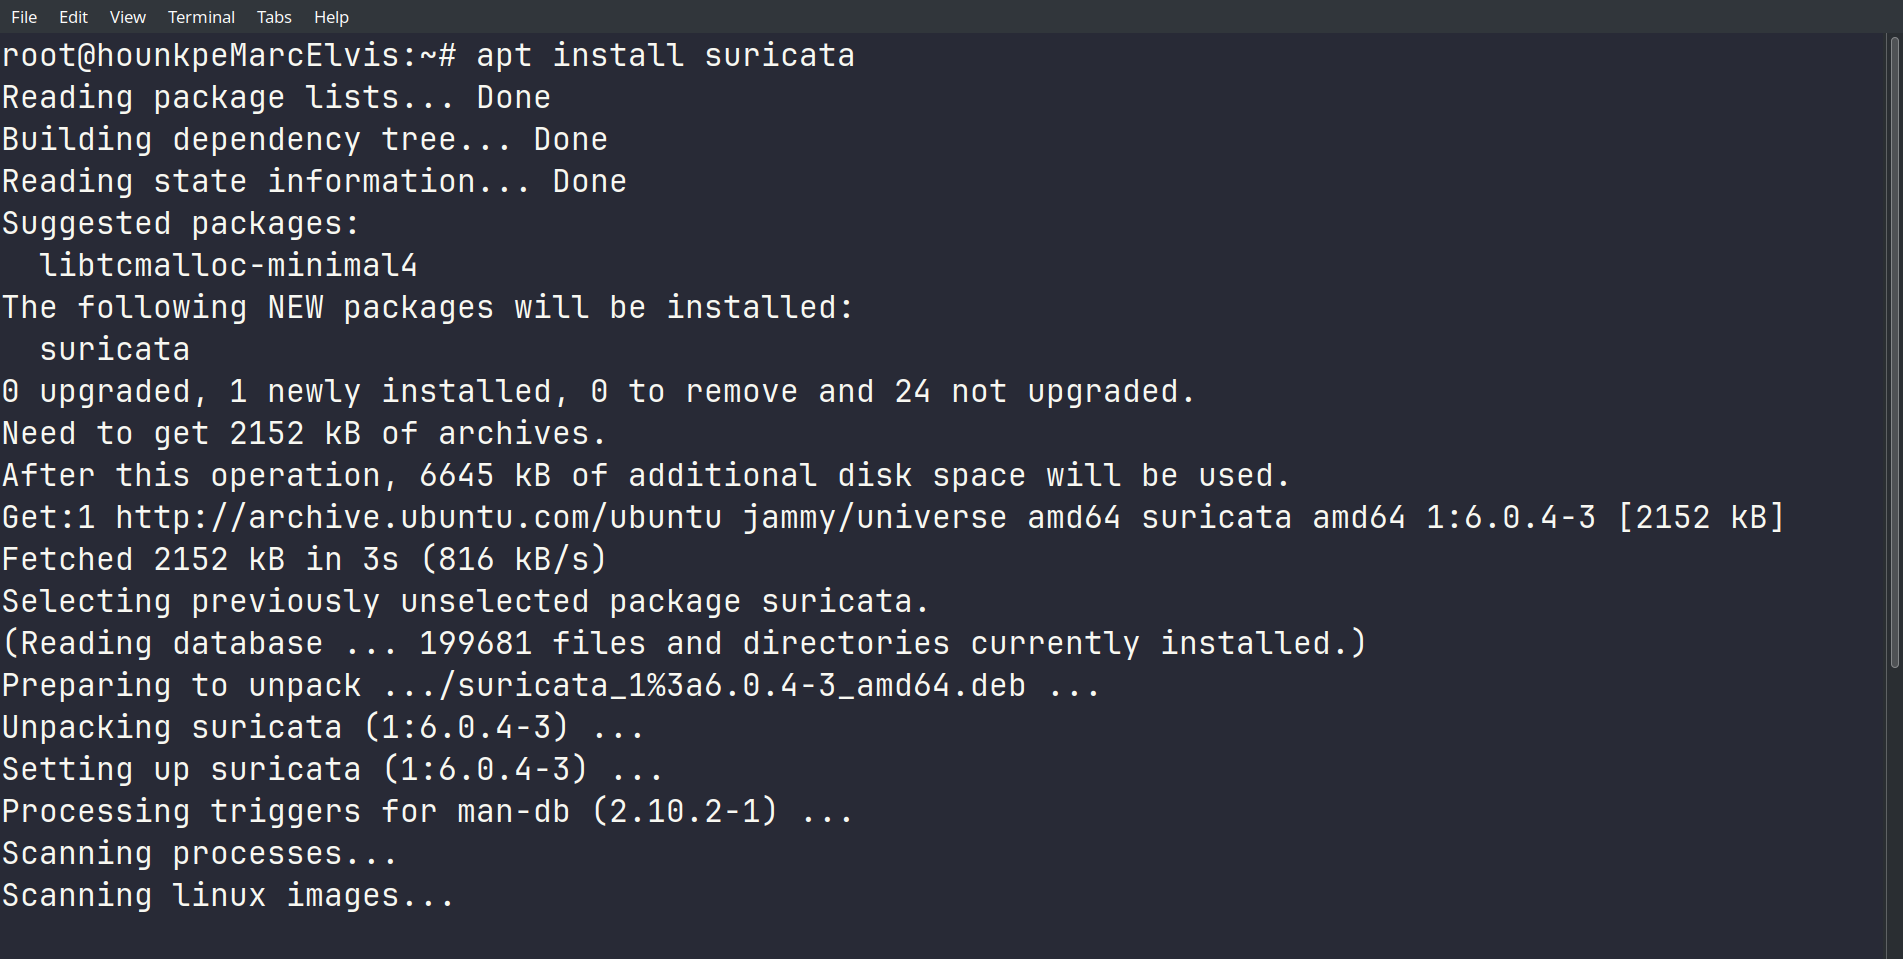
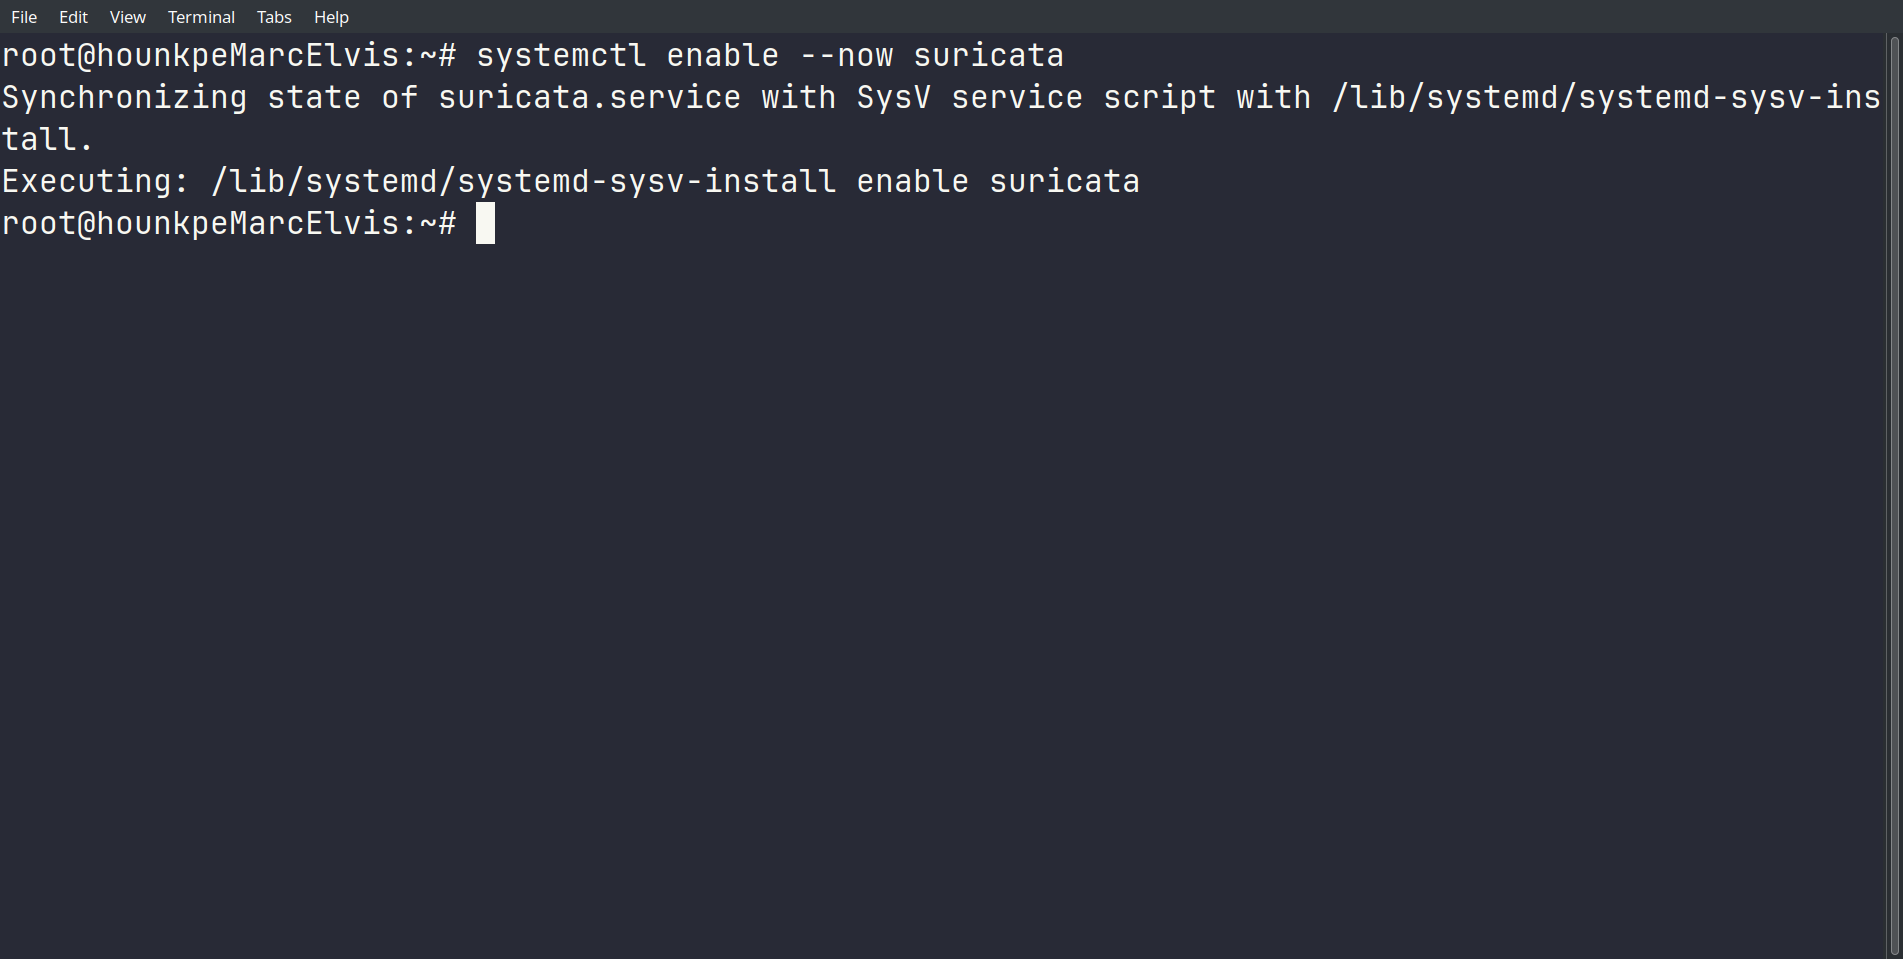
On active Suricata au démarrage :
Par défaut, Suricata utilise af-packet pour la capture de paquets. On modifie la configuration pour spécifier nos interfaces réseau :
enp0s8 — réseau interne entre la VM et l’hôteenp0s9 — réseau local principal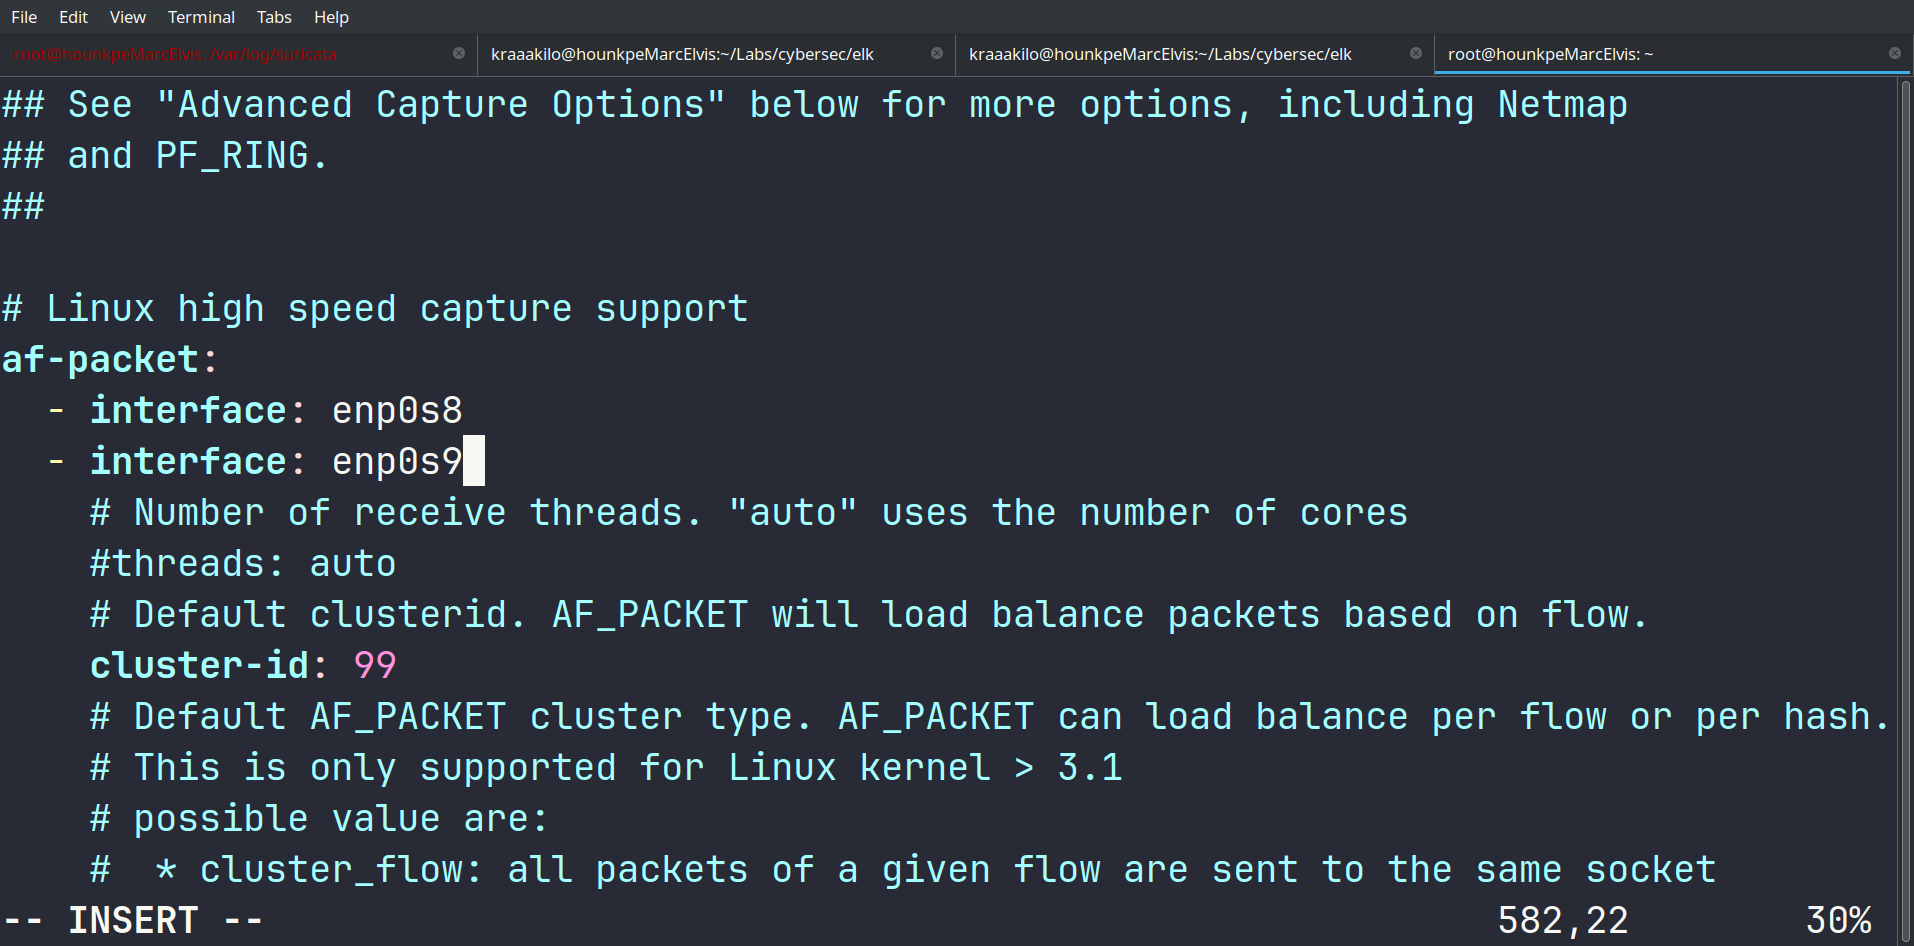
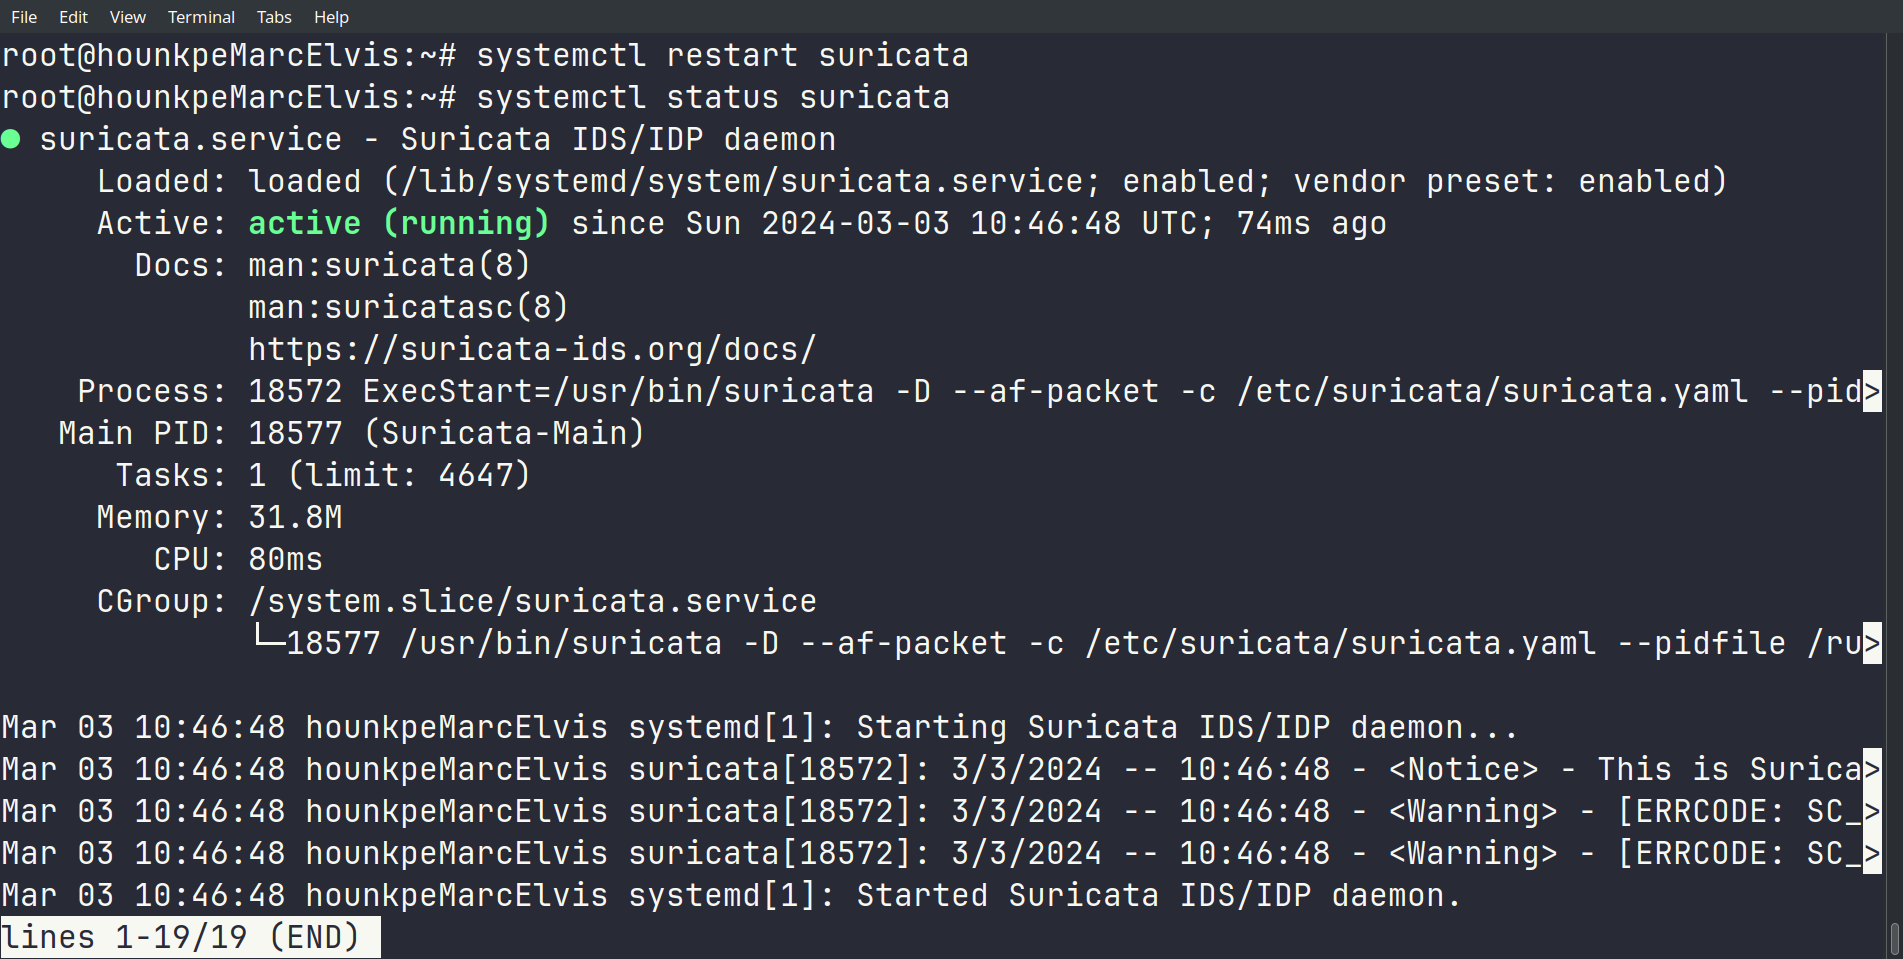
On vérifie que Suricata est bien actif après redémarrage :
À ce stade, Snort écoute sur toutes les interfaces et Suricata capture le trafic sur
enp0s8etenp0s9.
On a limité la mémoire d’Elasticsearch à 1 Go minimum et maximum. C’est suffisant pour nos tests, même si ça peut impacter les performances sur de gros volumes de logs.
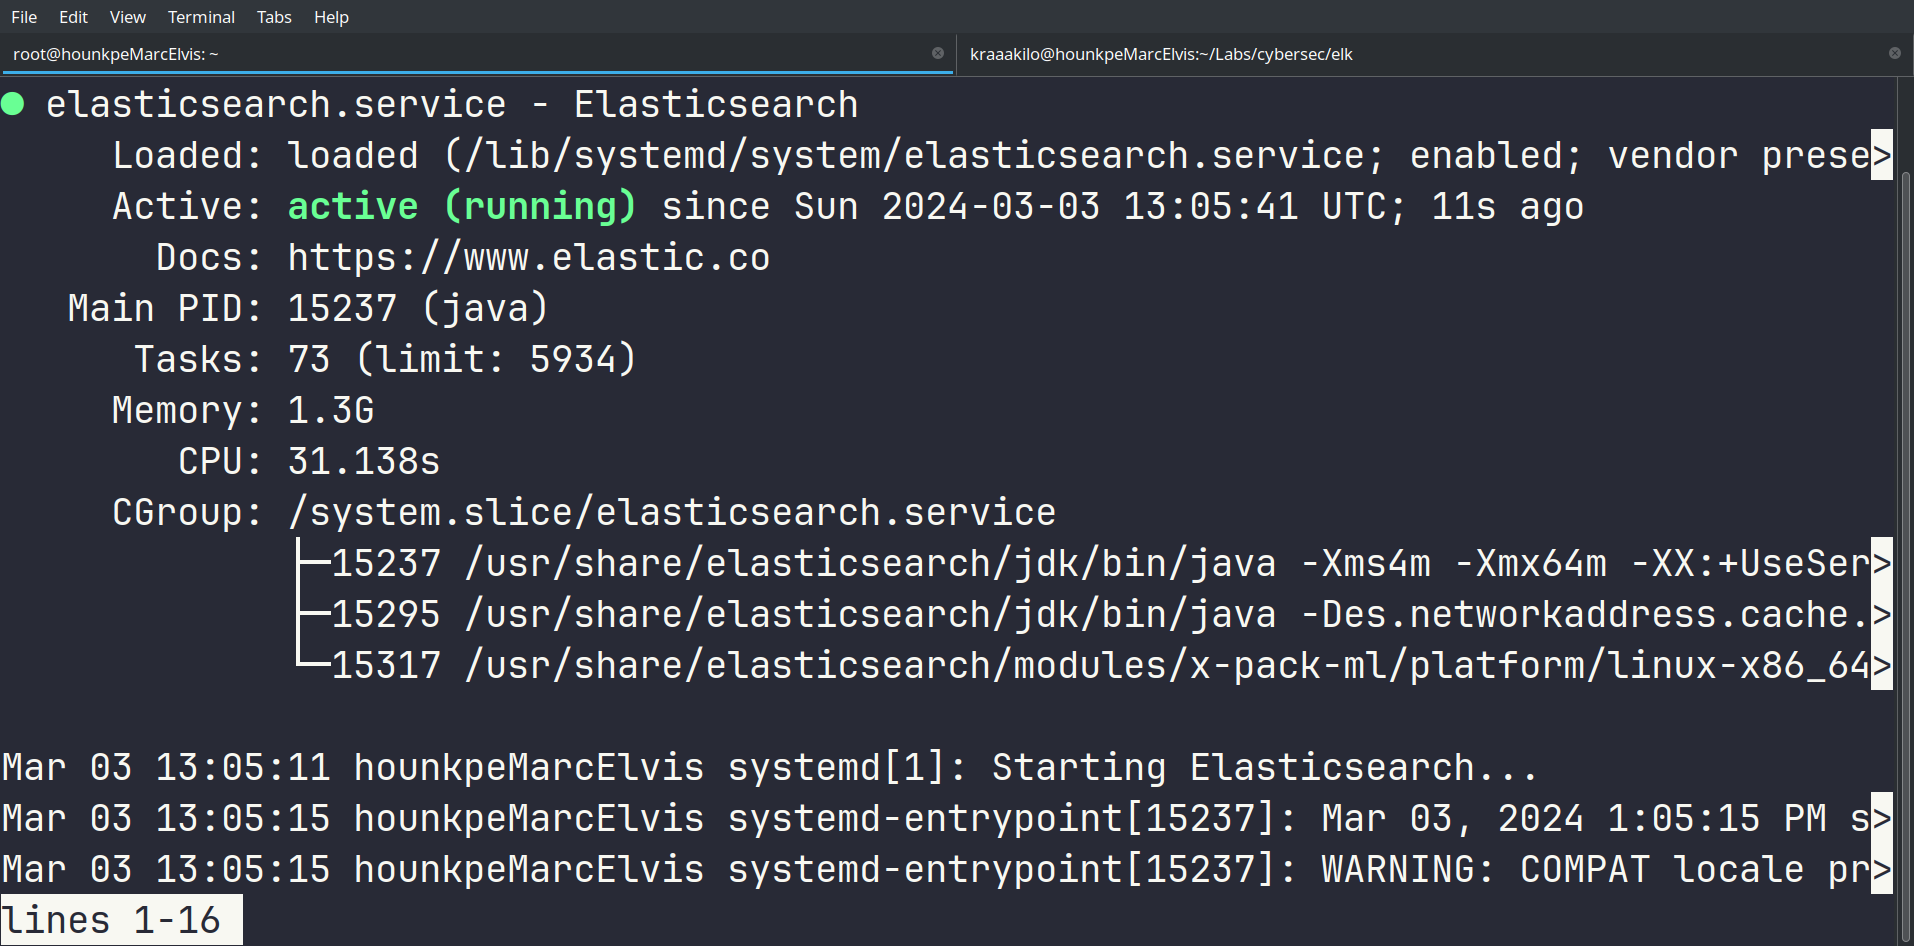
Elasticsearch est opérationnel :
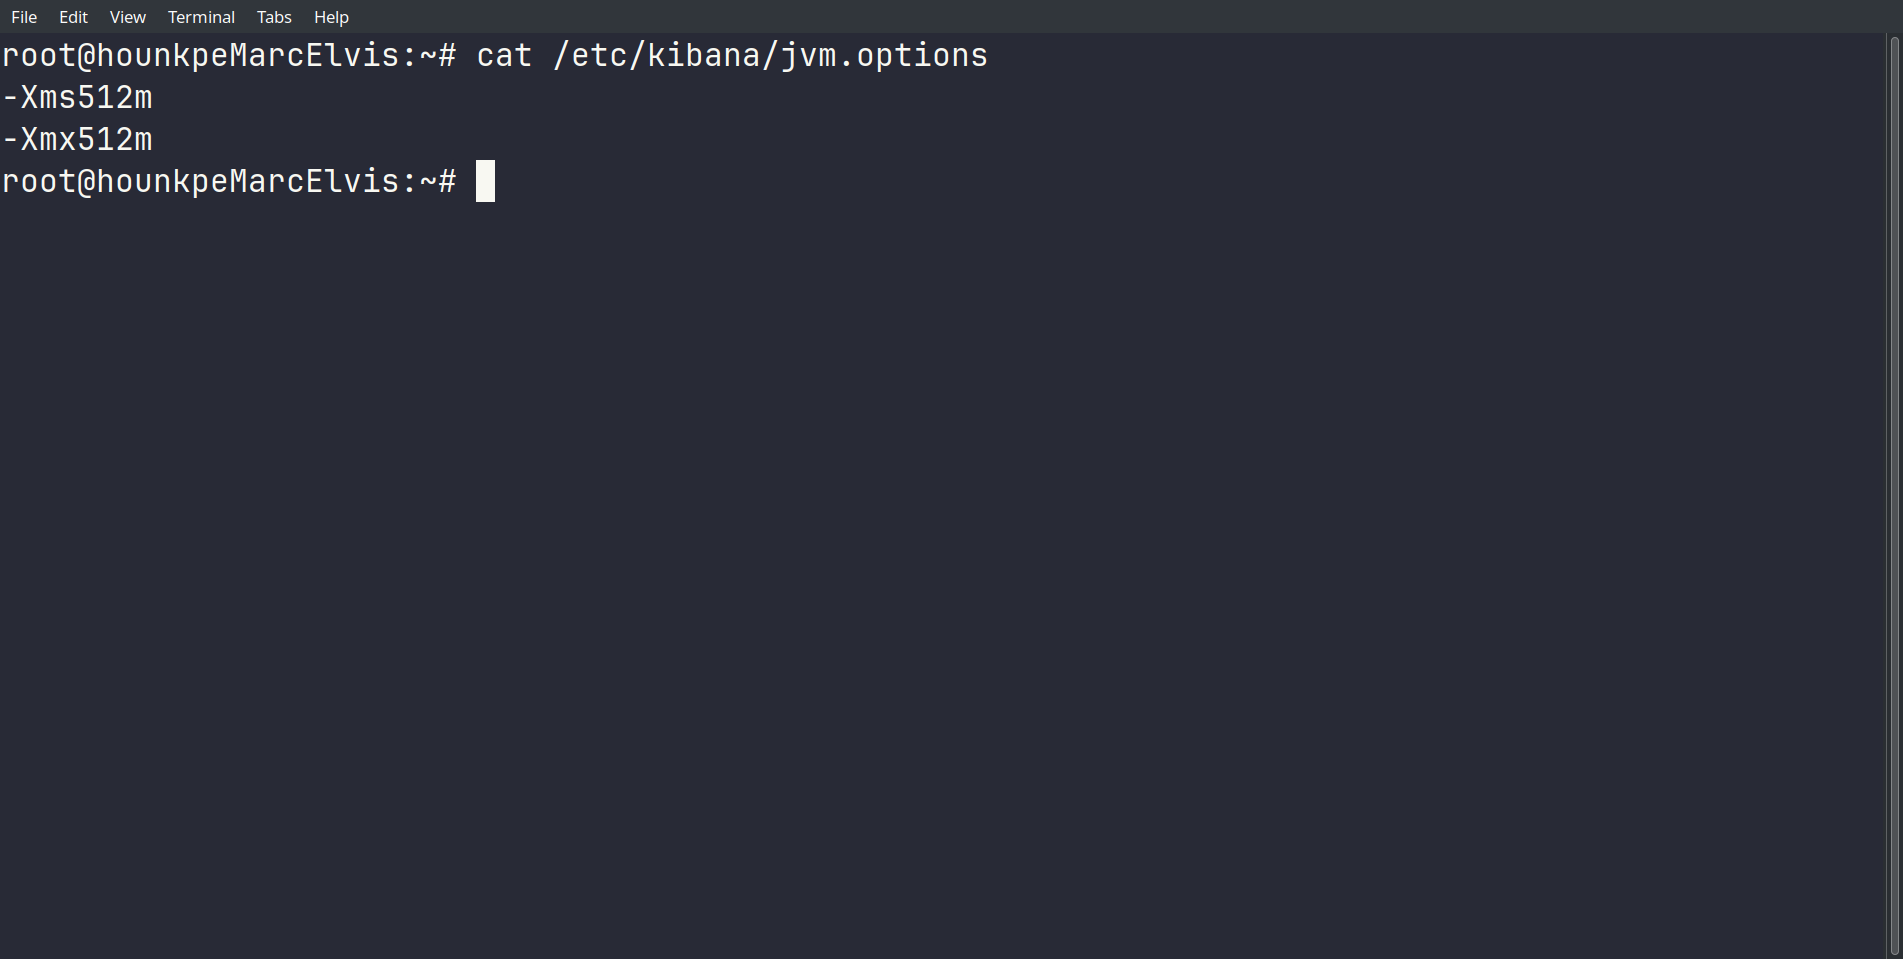
On limite Kibana à 512 Mo de mémoire.
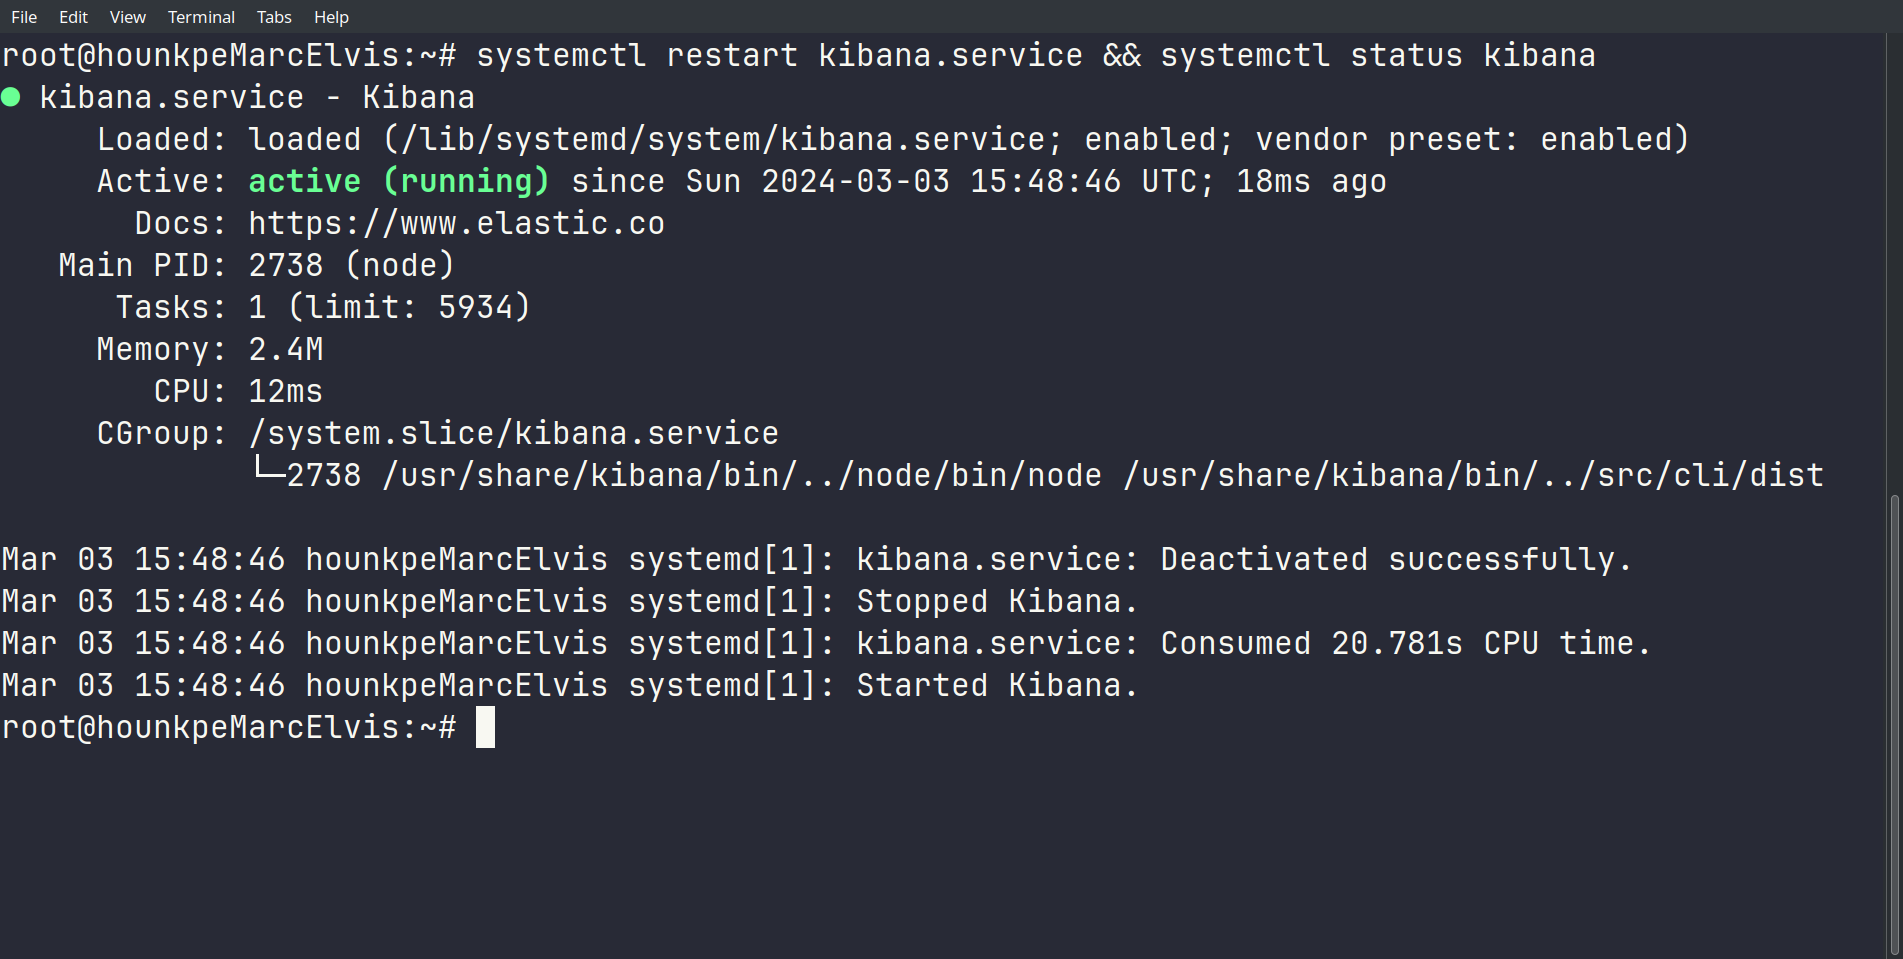
On redémarre et on vérifie le statut :
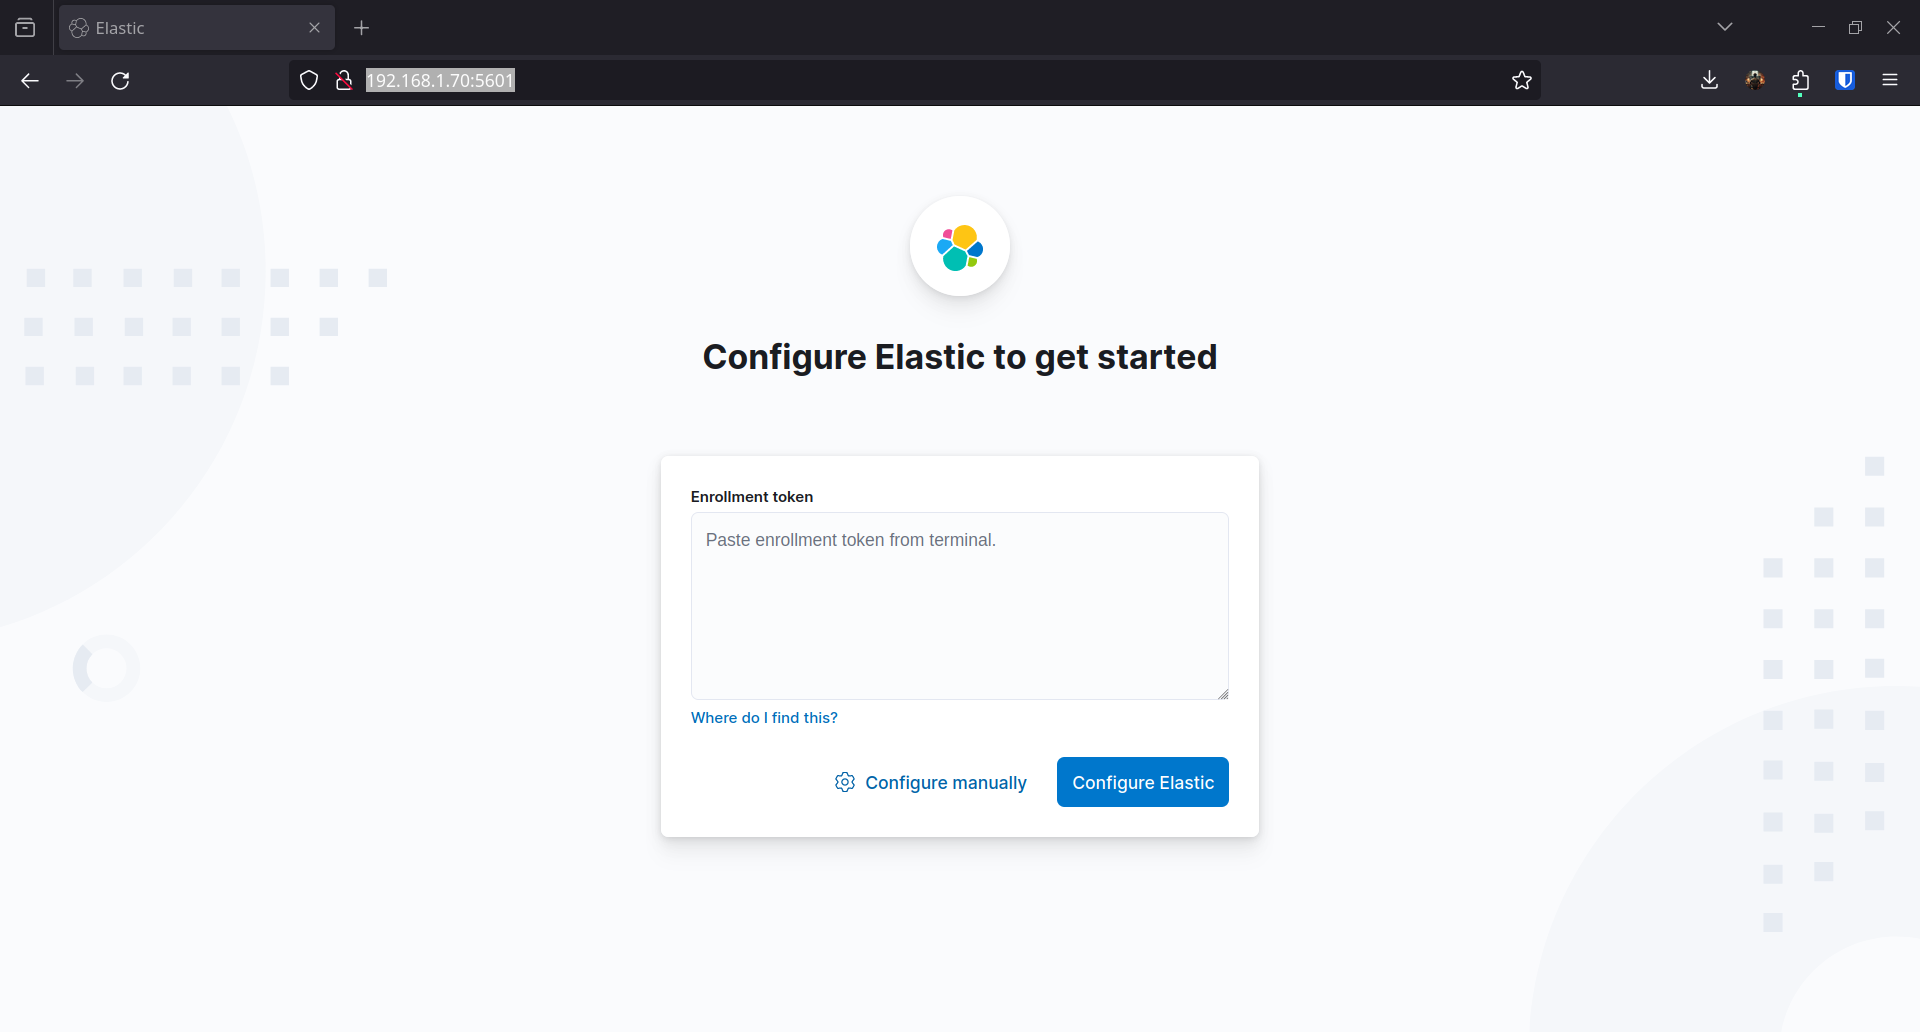
Dans le Vagrantfile, on a déjà configuré Kibana pour écouter sur 0.0.0.0 afin d’y accéder depuis l’extérieur de la VM :
sed -i 's|#server.host: "localhost"|server.host: "0.0.0.0"|g' /etc/kibana/kibana.ymlsed -i 's|#server.port: 5601|server.port: 5601|g' /etc/kibana/kibana.ymlOn accède à l’interface web sur http://192.168.1.70:5601/ :
On génère un token d’enrollment depuis Elasticsearch :
/usr/share/elasticsearch/bin/elasticsearch-create-enrollment-token --scope kibana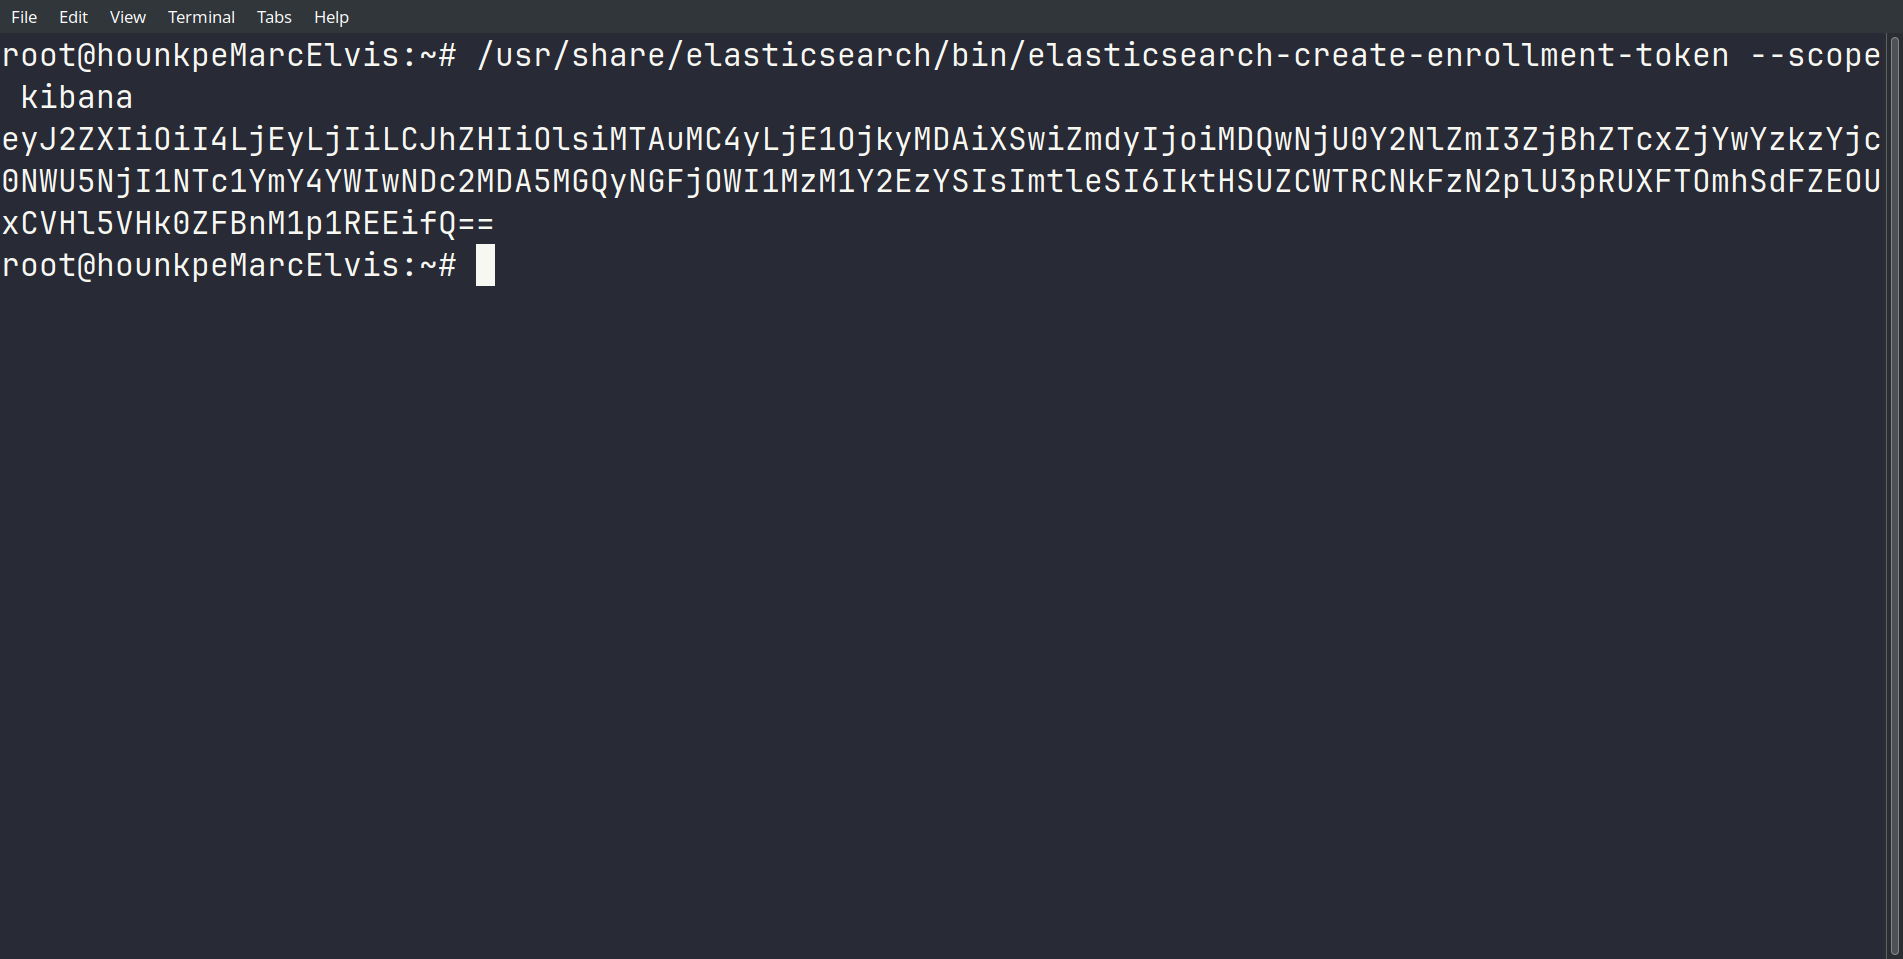
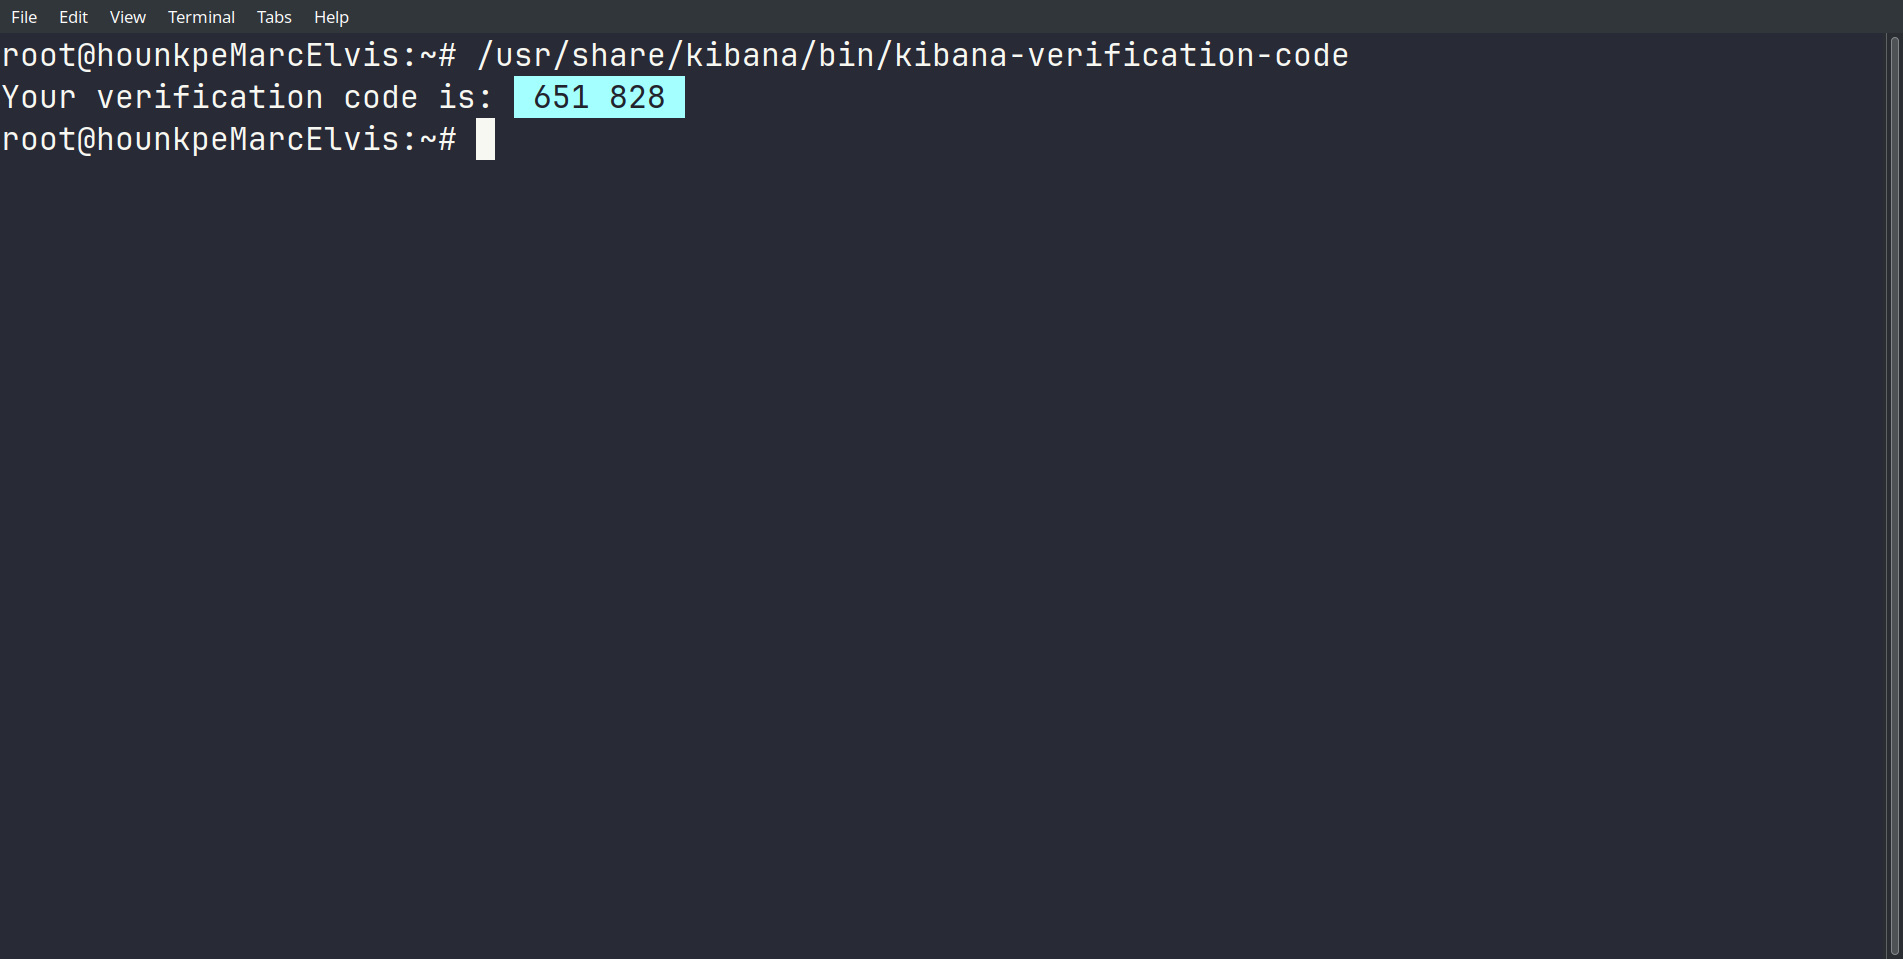
On entre ce token dans Kibana. Il demande ensuite un code de vérification :
/usr/share/kibana/bin/kibana-verification-code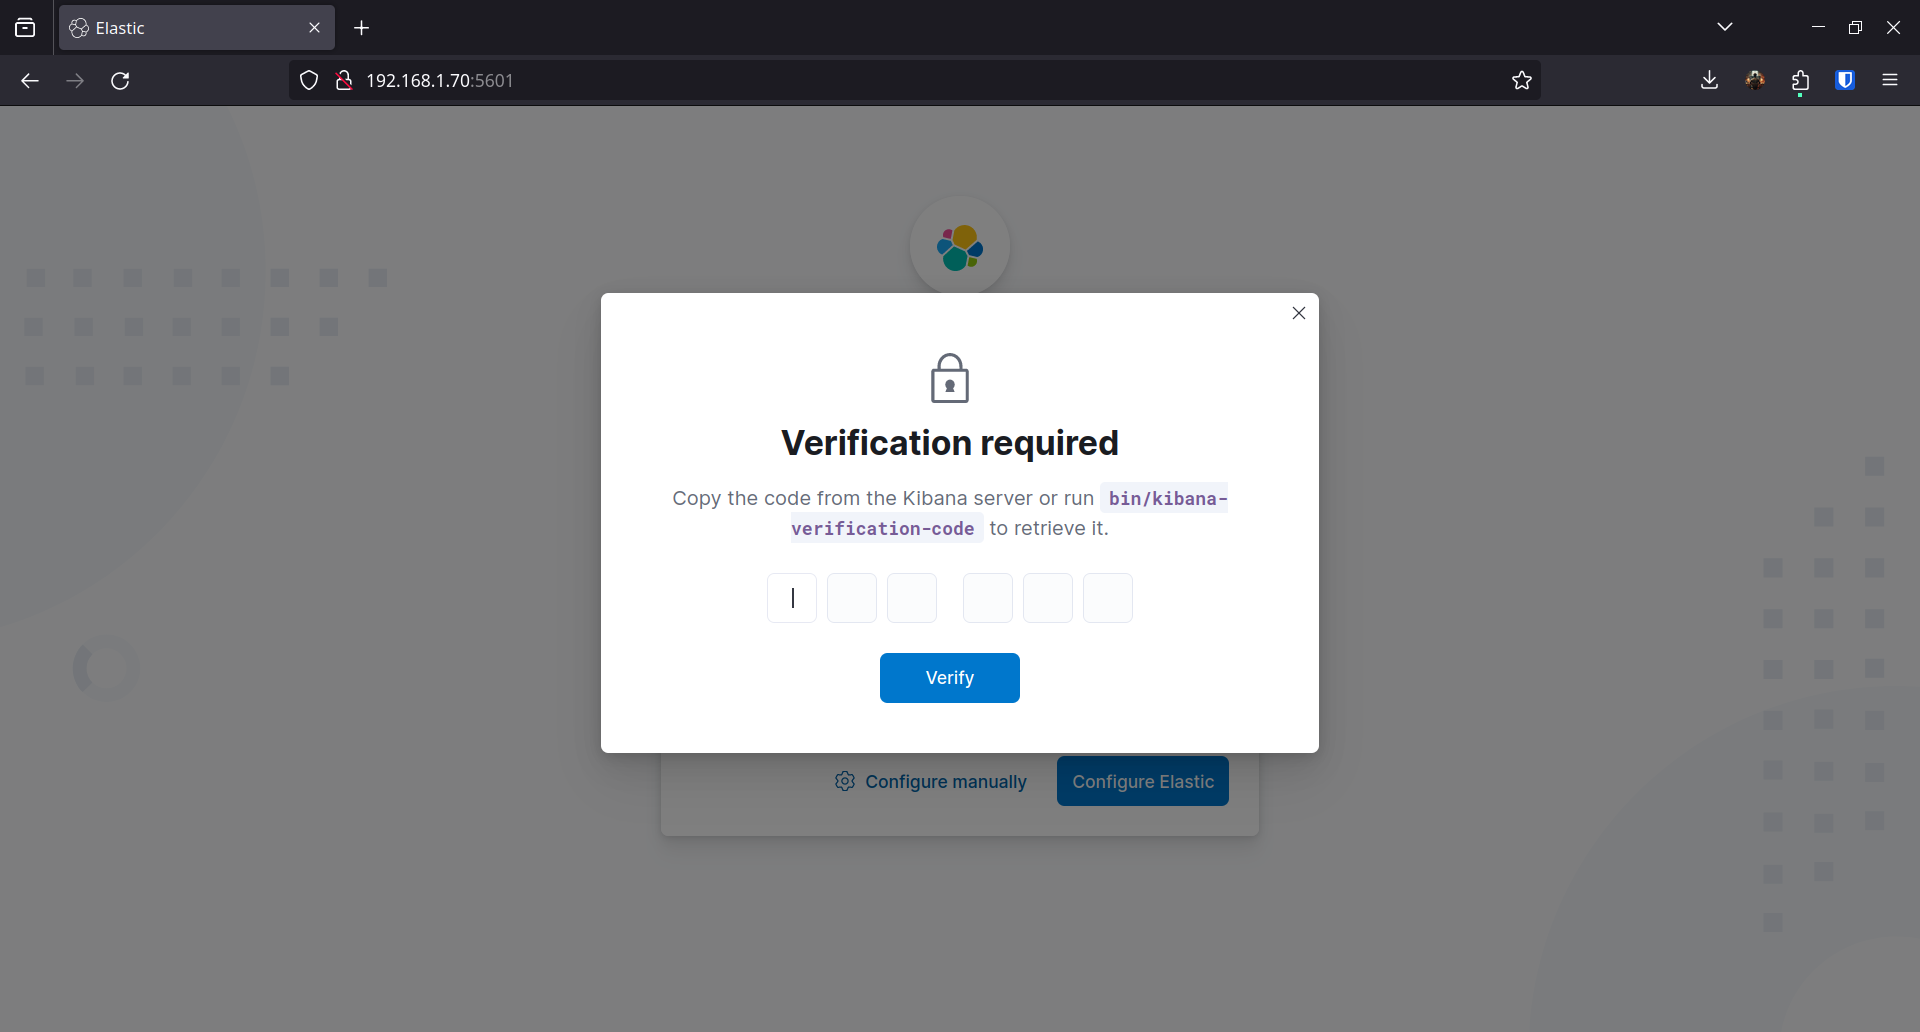
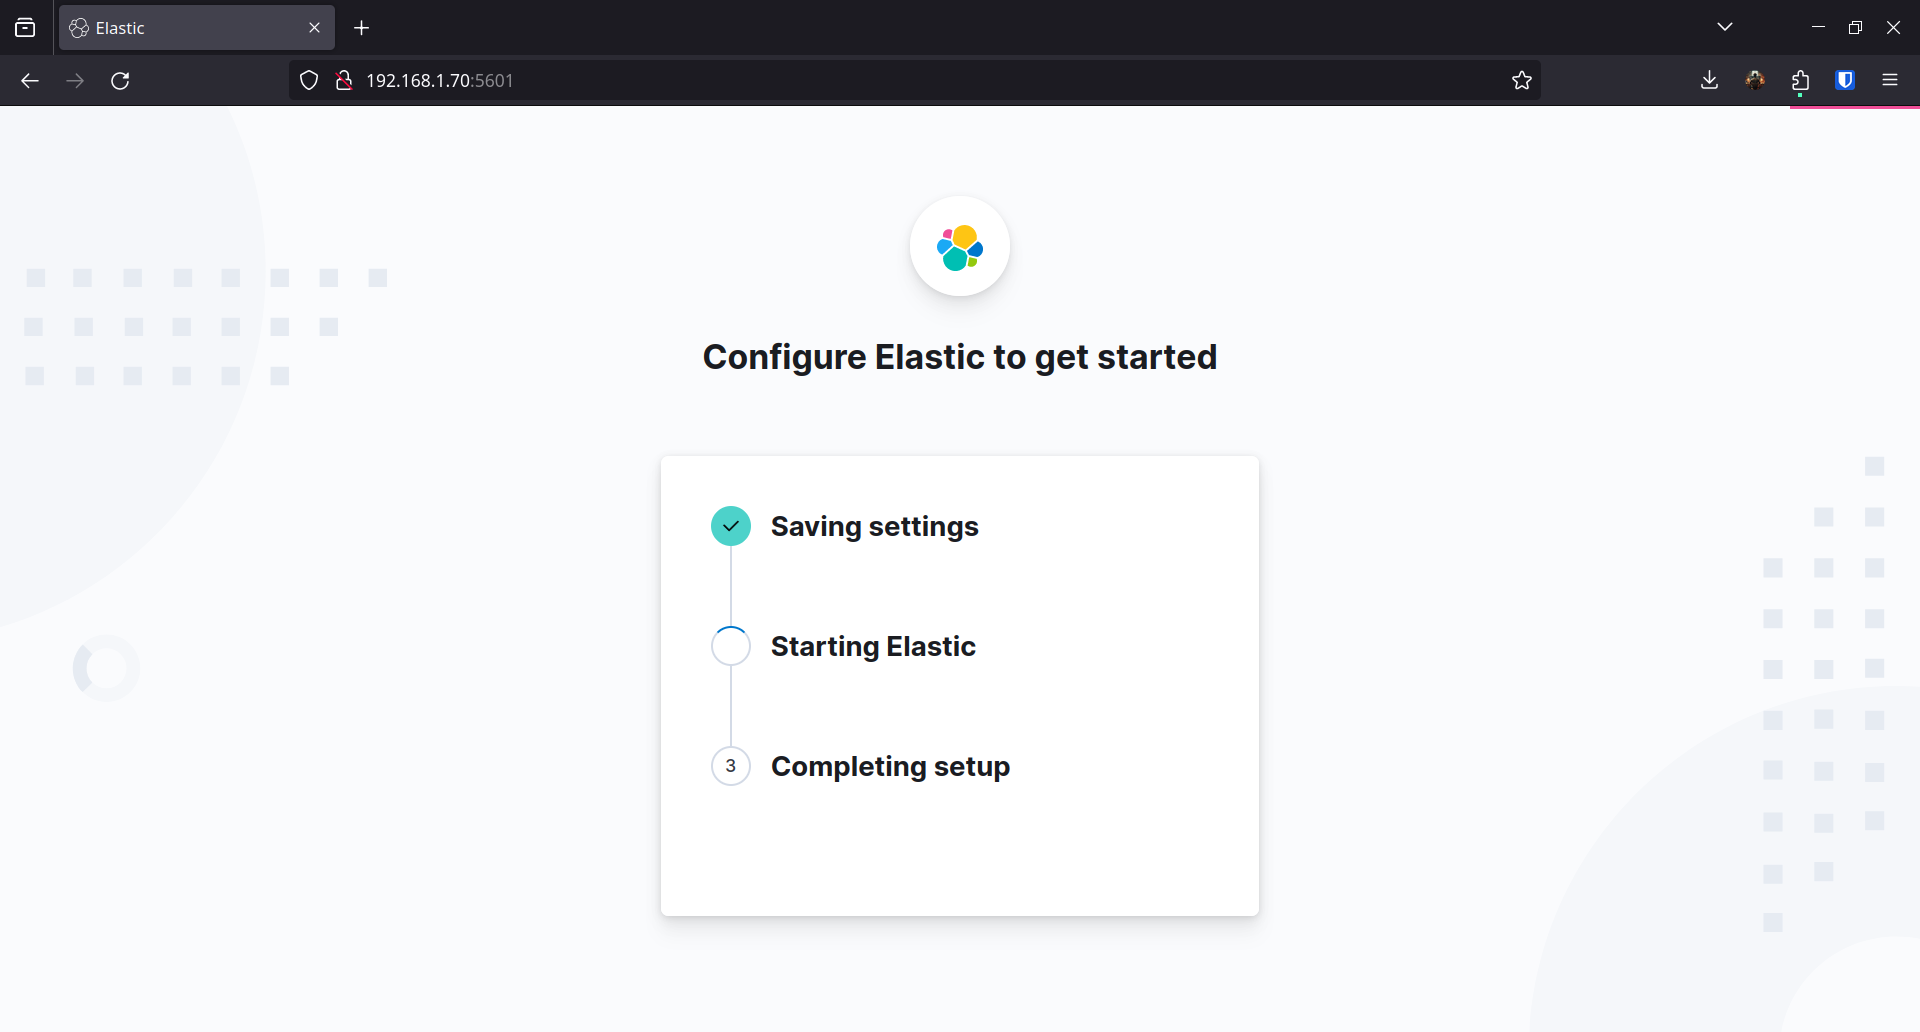
Kibana lance sa configuration automatique :
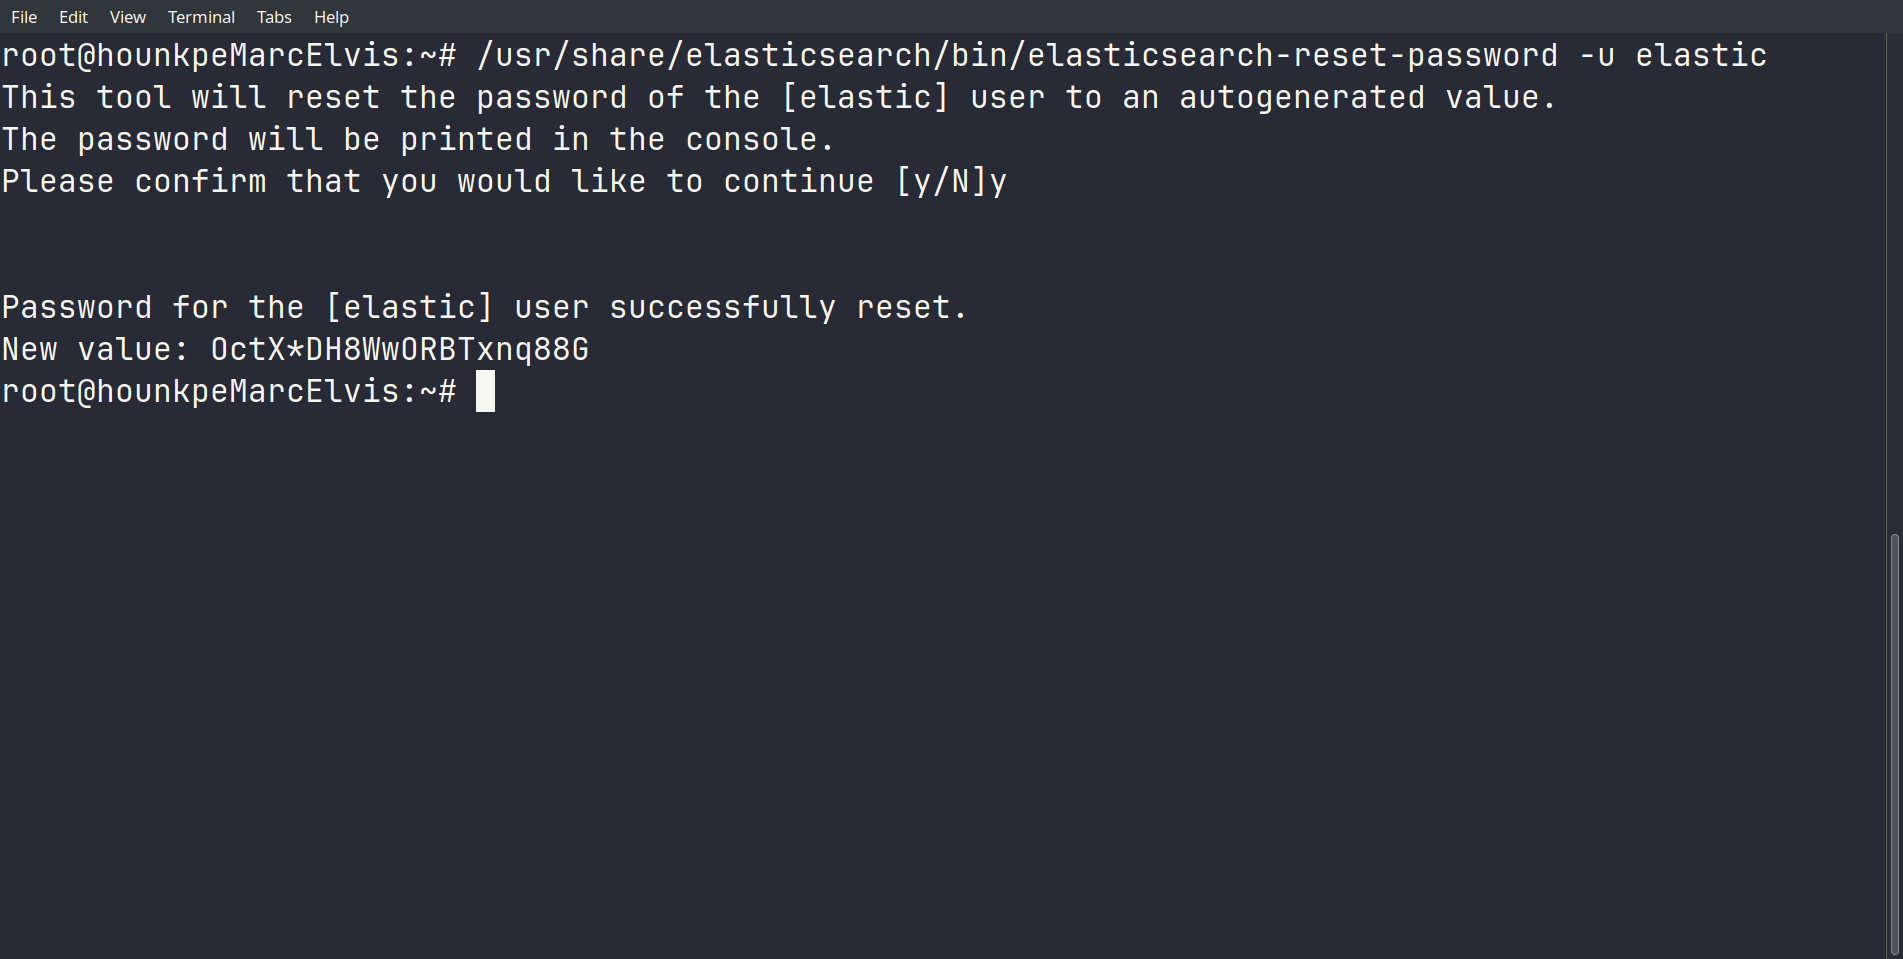
Pour se connecter, on doit d’abord réinitialiser le mot de passe du superuser elastic — on n’en avait pas défini lors de l’installation :
/usr/share/elasticsearch/bin/elasticsearch-reset-password -u elastic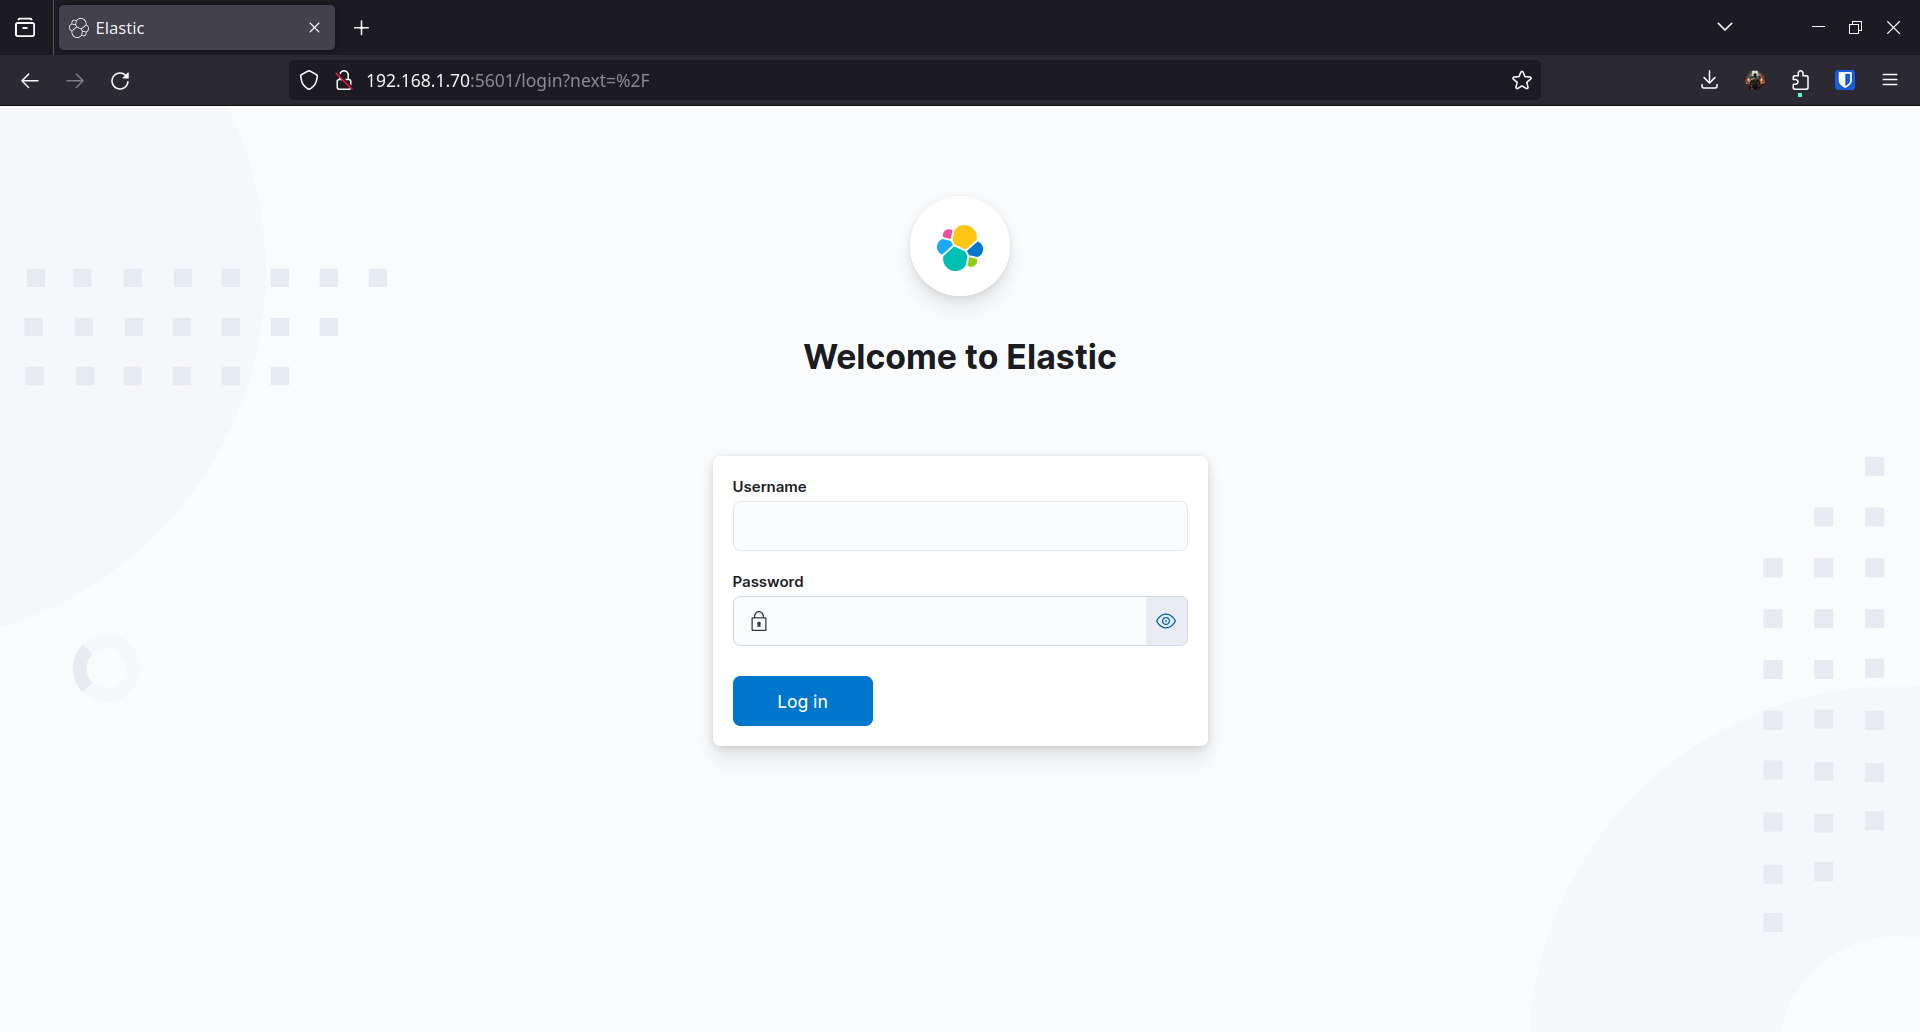
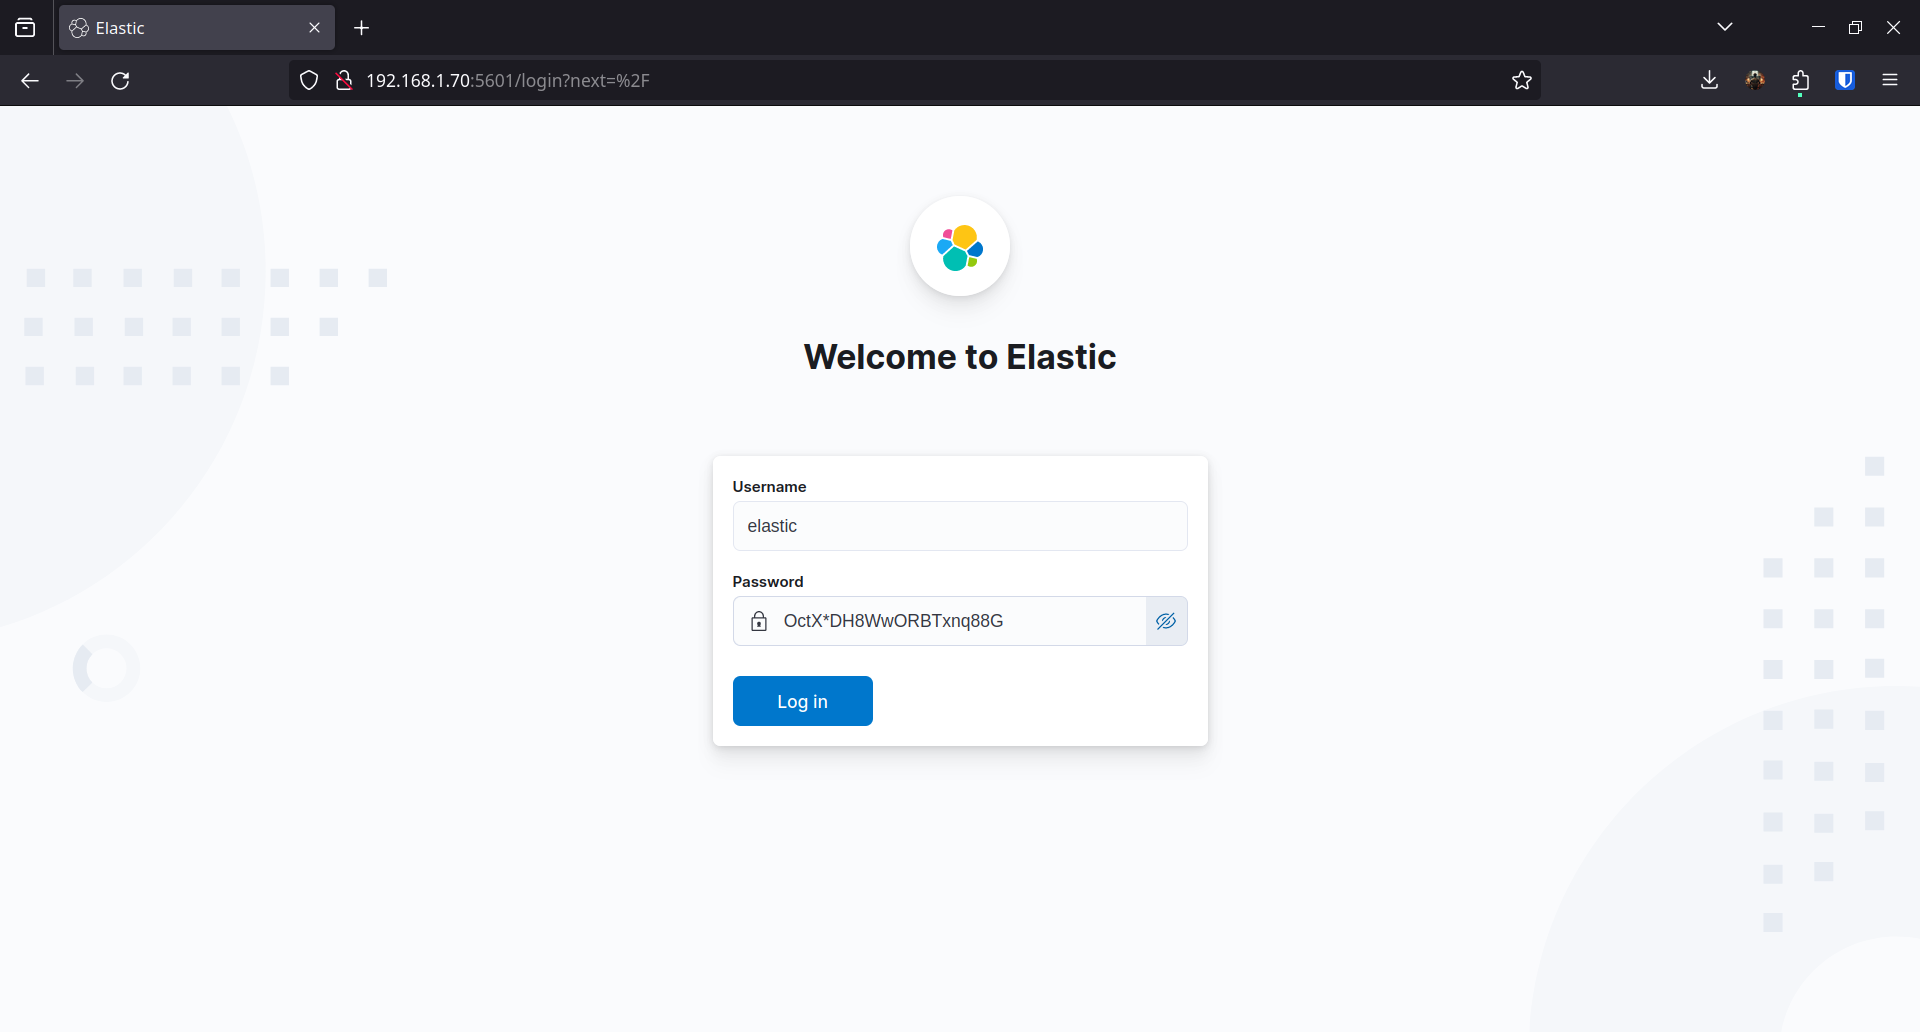
On se connecte avec ces credentials :
Logstash fonctionne avec des pipelines — chaque pipeline définit une source (input), des transformations (filter) et une destination (output). On en crée un pour Snort et un pour Suricata.
input {    file {        path => "/var/log/snort/snort.alert.fast"        start_position => "beginning"        sincedb_path => "/dev/null"    }}
filter {    grok {        match => { "message" => "%{MONTHNUM}/%{MONTHDAY}-%{TIME} %{DATA} \[%{DATA}\] \[%{DATA:signature}\] \[%{DATA}\] \[Priority: %{INT:priority}\] \{%{WORD:protocol}\} %{IP:source_address}:%{NUMBER:source_port} -> %{IP:destination_address}:%{NUMBER:destination_port}" }    }
    date {        match => [ "timestamp", "dd/MMM/yyyy:HH:mm:ss Z" ]        target => "@timestamp"    }}
output {    elasticsearch {        index => "logstash-%{+YYYY.MM.dd}"        hosts => ["https://localhost:9200"]        user => "elastic"        password => "maybe_secure_password_here ?!"        ssl => true        cacert => "/etc/elasticsearch/certs/http_ca.crt"        ssl_certificate_verification => true        manage_template => false    }    stdout { codec => rubydebug }}
Le filtre grok parse les logs Snort et extrait les champs utiles : signature, priorité, protocole, adresses et ports source/destination. Le filtre date convertit le timestamp en format compatible Elasticsearch.
input {  file {    path => ["/var/log/suricata/eve.json"]    sincedb_path => "/var/lib/logstash/sincedb_suricata"    codec => json    type => "SuricataIDPS"  }}
filter {  if [type] == "SuricataIDPS" {    date {      match => [ "timestamp", "ISO8601" ]    }    ruby {      code => "if event['event_type'] == 'fileinfo'; event['fileinfo']['type']=event['fileinfo']['magic'].to_s.split(',')[0]; end;"    }  }
  if [src_ip]  {    geoip {      source => "src_ip"      target => "geoip"      add_field => [ "[geoip][coordinates]", "%{[geoip][longitude]}" ]      add_field => [ "[geoip][coordinates]", "%{[geoip][latitude]}"  ]    }    mutate {      convert => [ "[geoip][coordinates]", "float" ]    }    if ![geoip.ip] {      if [dest_ip]  {        geoip {          source => "dest_ip"          target => "geoip"          add_field => [ "[geoip][coordinates]", "%{[geoip][longitude]}" ]          add_field => [ "[geoip][coordinates]", "%{[geoip][latitude]}"  ]        }        mutate {          convert => [ "[geoip][coordinates]", "float" ]        }      }    }  }}
output {  elasticsearch {    index => "logstash-%{+YYYY.MM.dd}"    hosts => ["https://localhost:9200"]    user => "elastic"    password => "maybe_secure_password_here ?!"    ssl => true    cacert => "/etc/elasticsearch/certs/http_ca.crt"    ssl_certificate_verification => true    manage_template => false  }  stdout { codec => rubydebug }}
Suricata écrit ses logs en JSON dans eve.json — on utilise codec => json pour les parser directement. Le filtre geoip enrichit les événements avec les coordonnées géographiques associées aux IPs source et destination. Le bloc ruby extrait le type de fichier depuis le champ magic pour les événements fileinfo.
Avant d’envoyer les données vers Elasticsearch, on retire le bloc output elasticsearch des pipelines pour tester uniquement avec la console.
/usr/share/logstash/bin/logstash --path.settings /etc/logstash/ -f /etc/logstash/conf.d/snort-pipeline.conf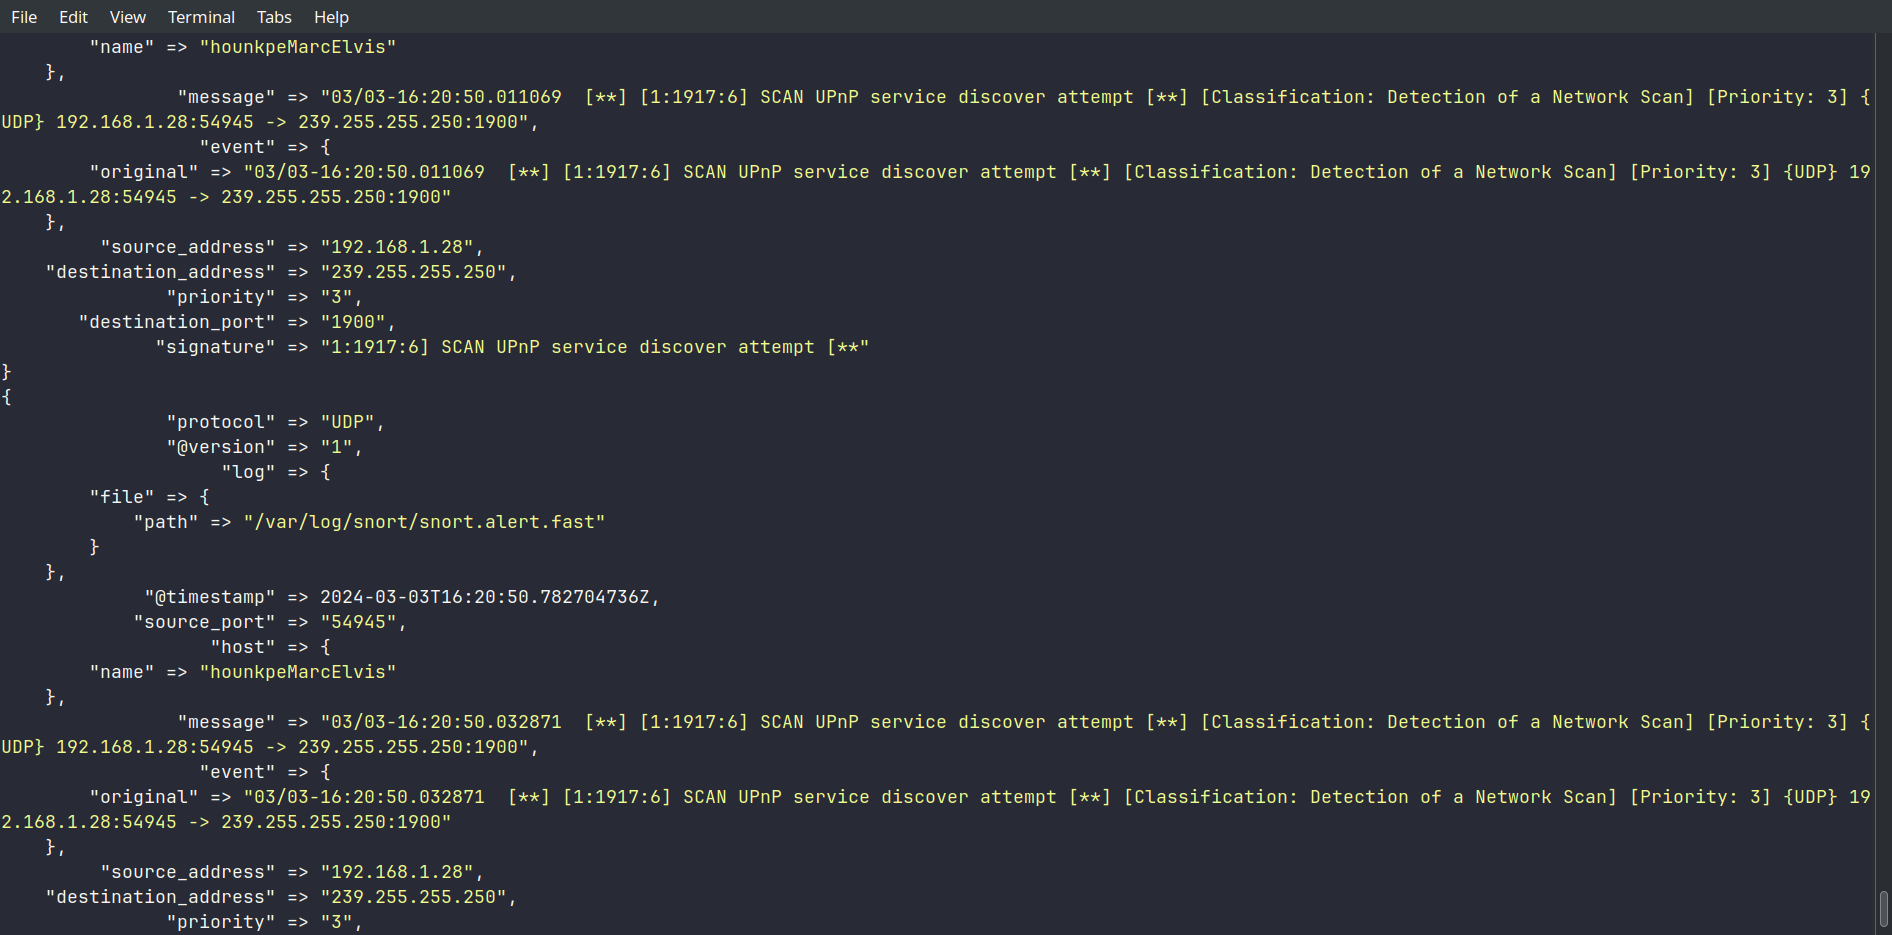
Les données sont bien structurées — les champs correspondent à ce qu’on attendait.
/usr/share/logstash/bin/logstash --path.settings /etc/logstash/ -f /etc/logstash/conf.d/suricata-pipeline.conf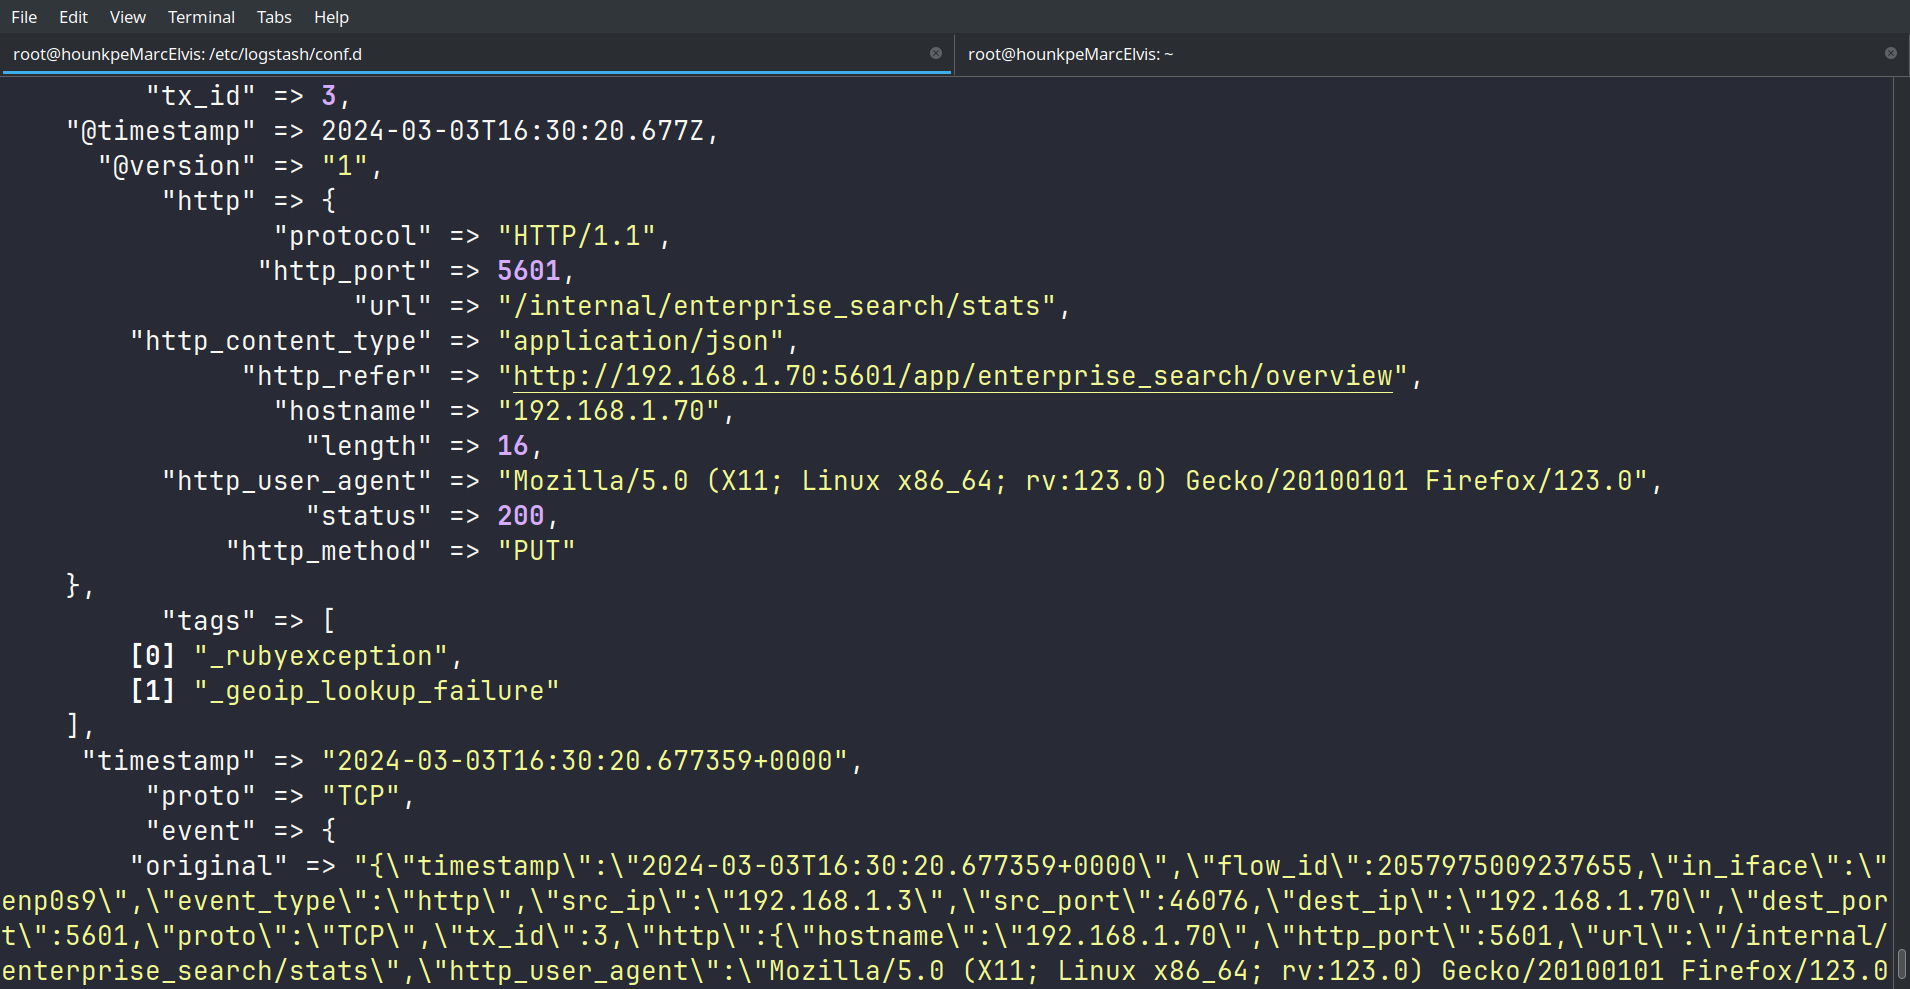
Même résultat — les logs Suricata sont correctement parsés.
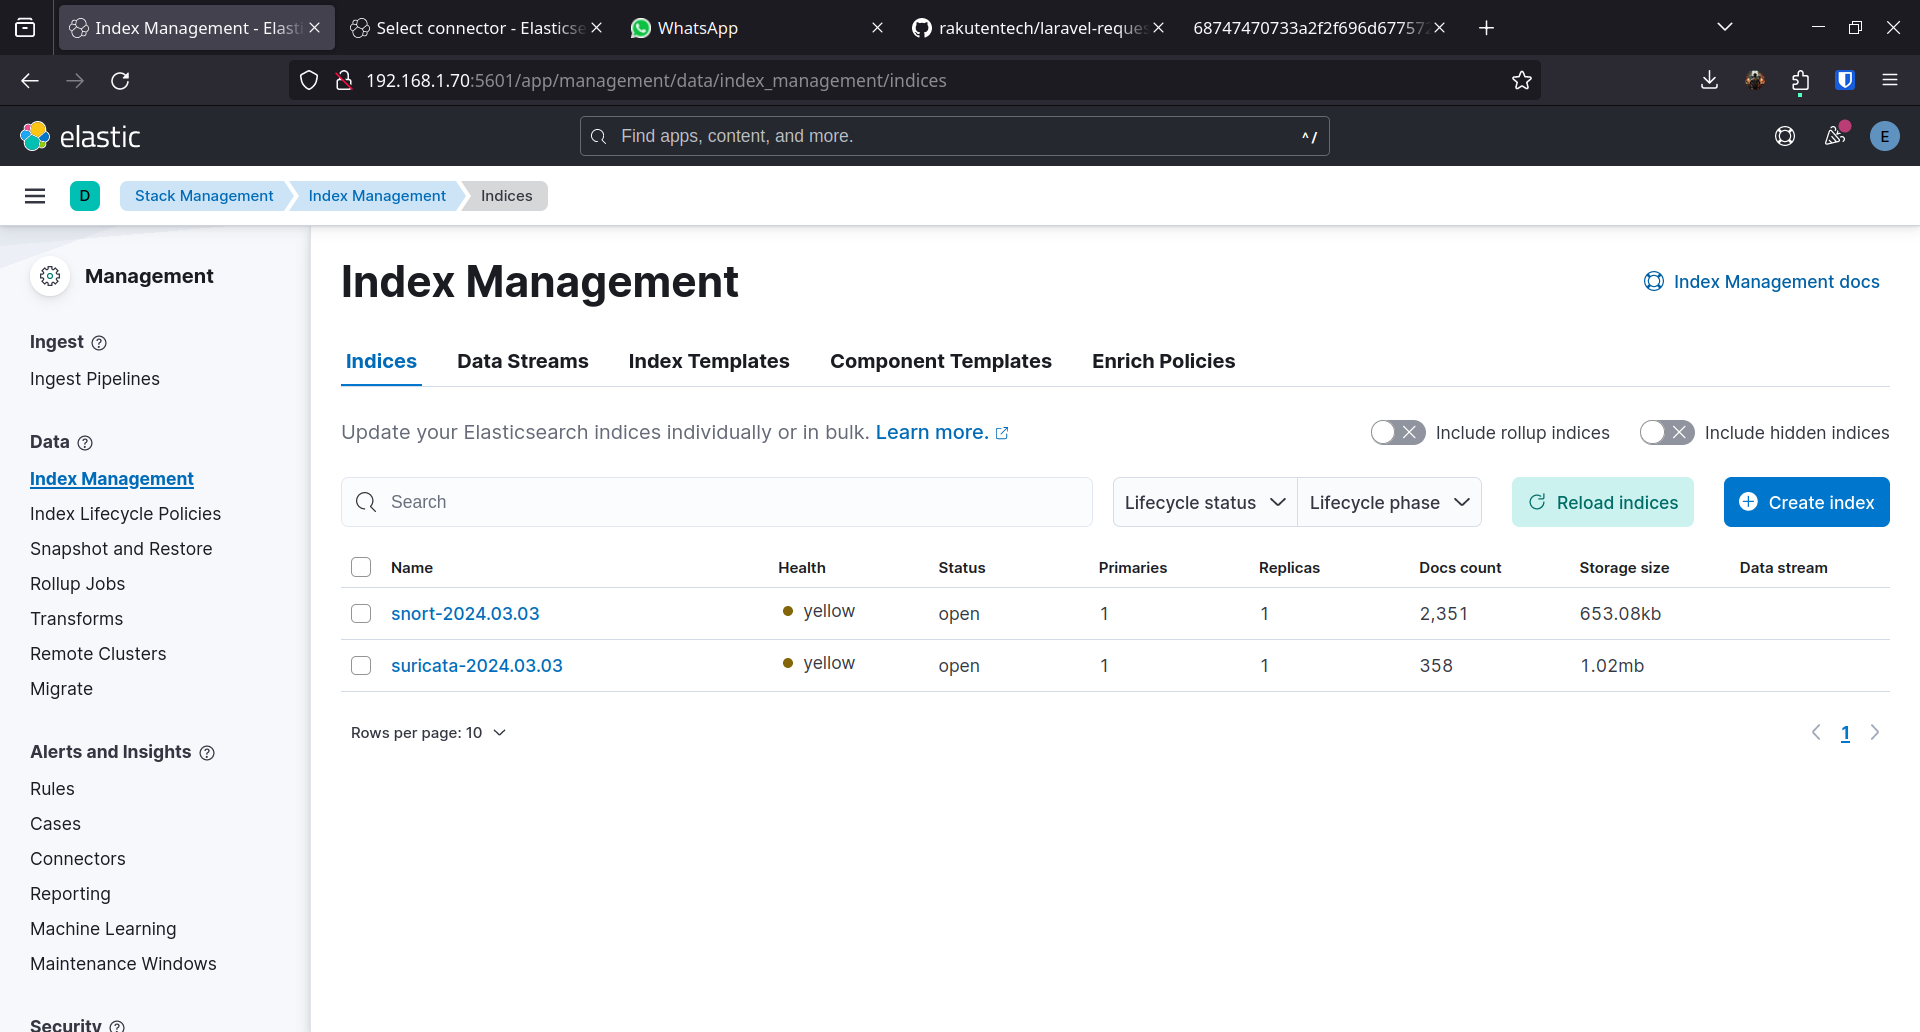
Les tests sont bons. On remet le bloc output elasticsearch et on ajuste les noms d’index pour les retrouver facilement dans Kibana :
# Snortoutput {    elasticsearch {        index => "snort-%{+YYYY.MM.dd}"        ...    }}
# Suricataoutput {    elasticsearch {        index => "suricata-%{+YYYY.MM.dd}"        ...    }}
Les index sont créés dans Elasticsearch :
On va dans l’onglet Analytics > Dashboards pour créer les visualisations.
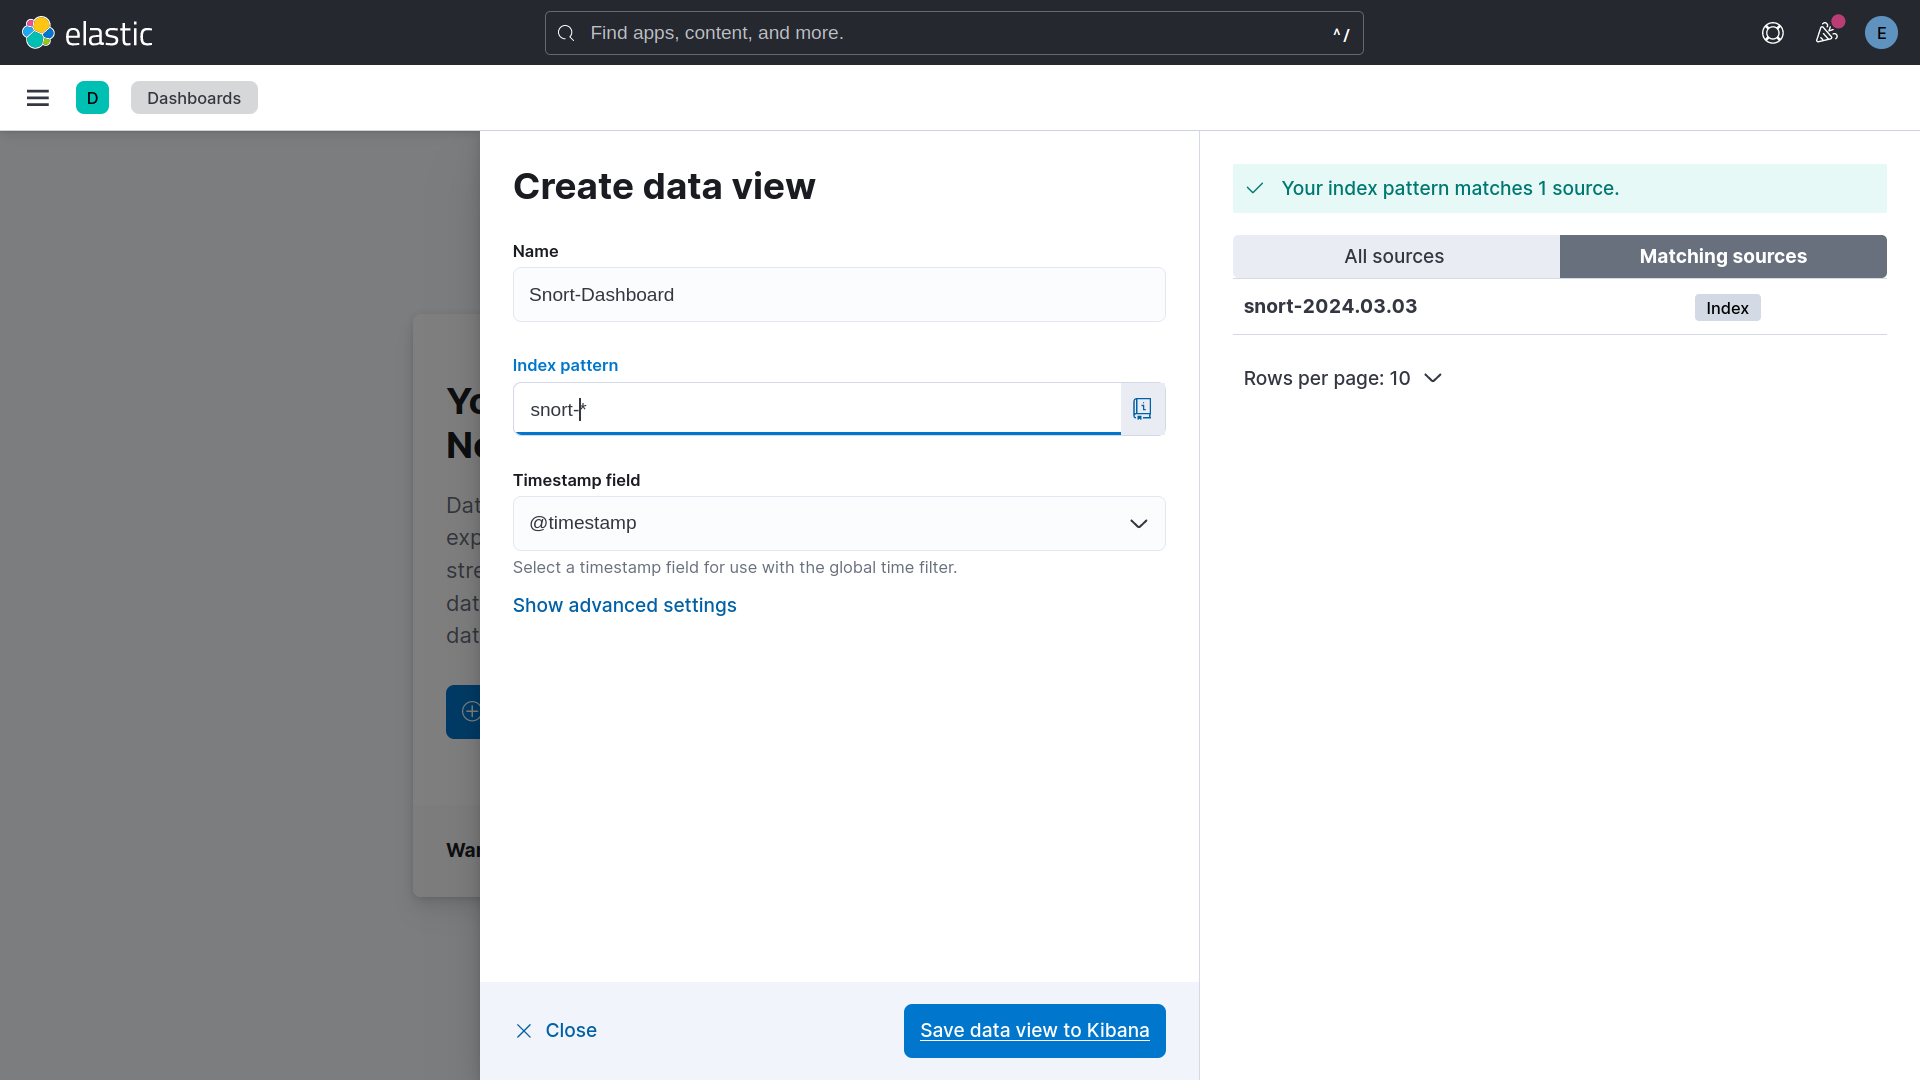
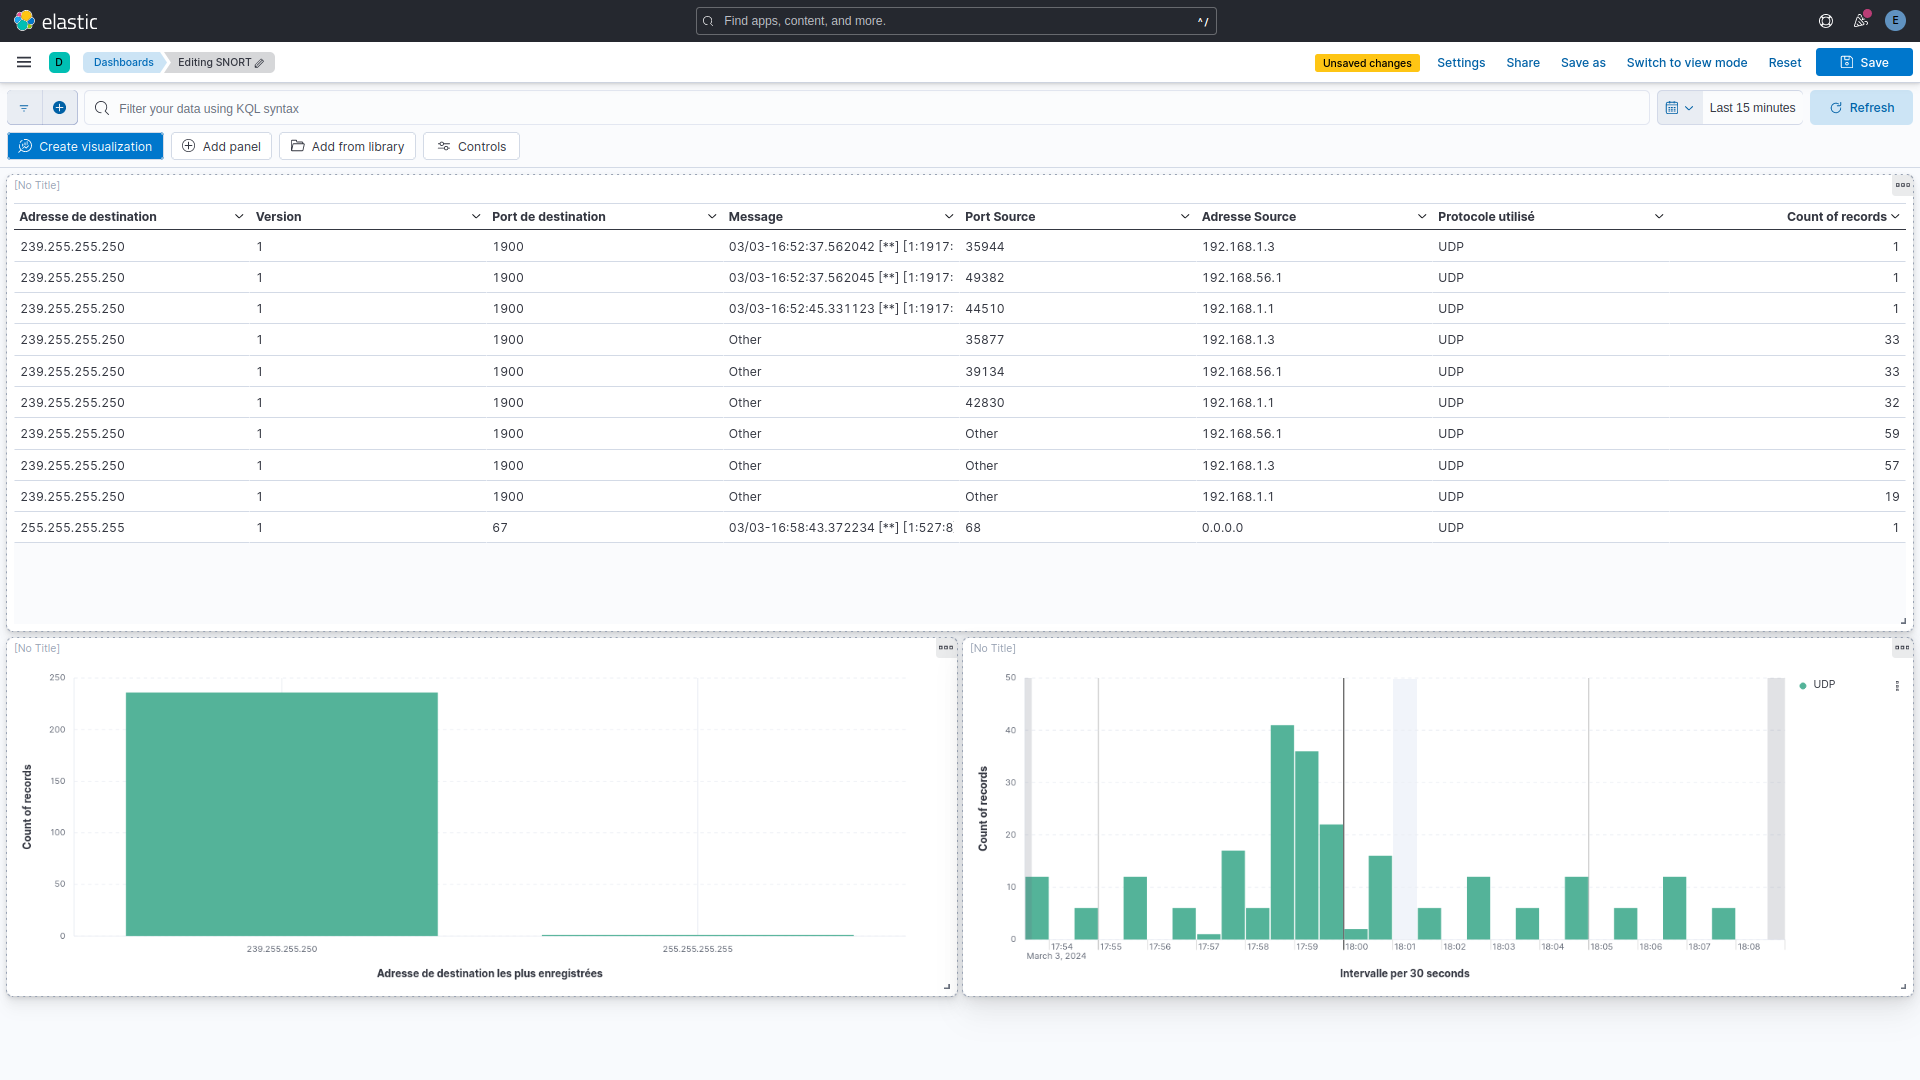
On crée un index pattern snort-* pour associer tous les index Snort au dashboard.
On crée une table avec les informations principales et deux graphiques — les protocoles les plus utilisés et les adresses de destination les plus contactées.
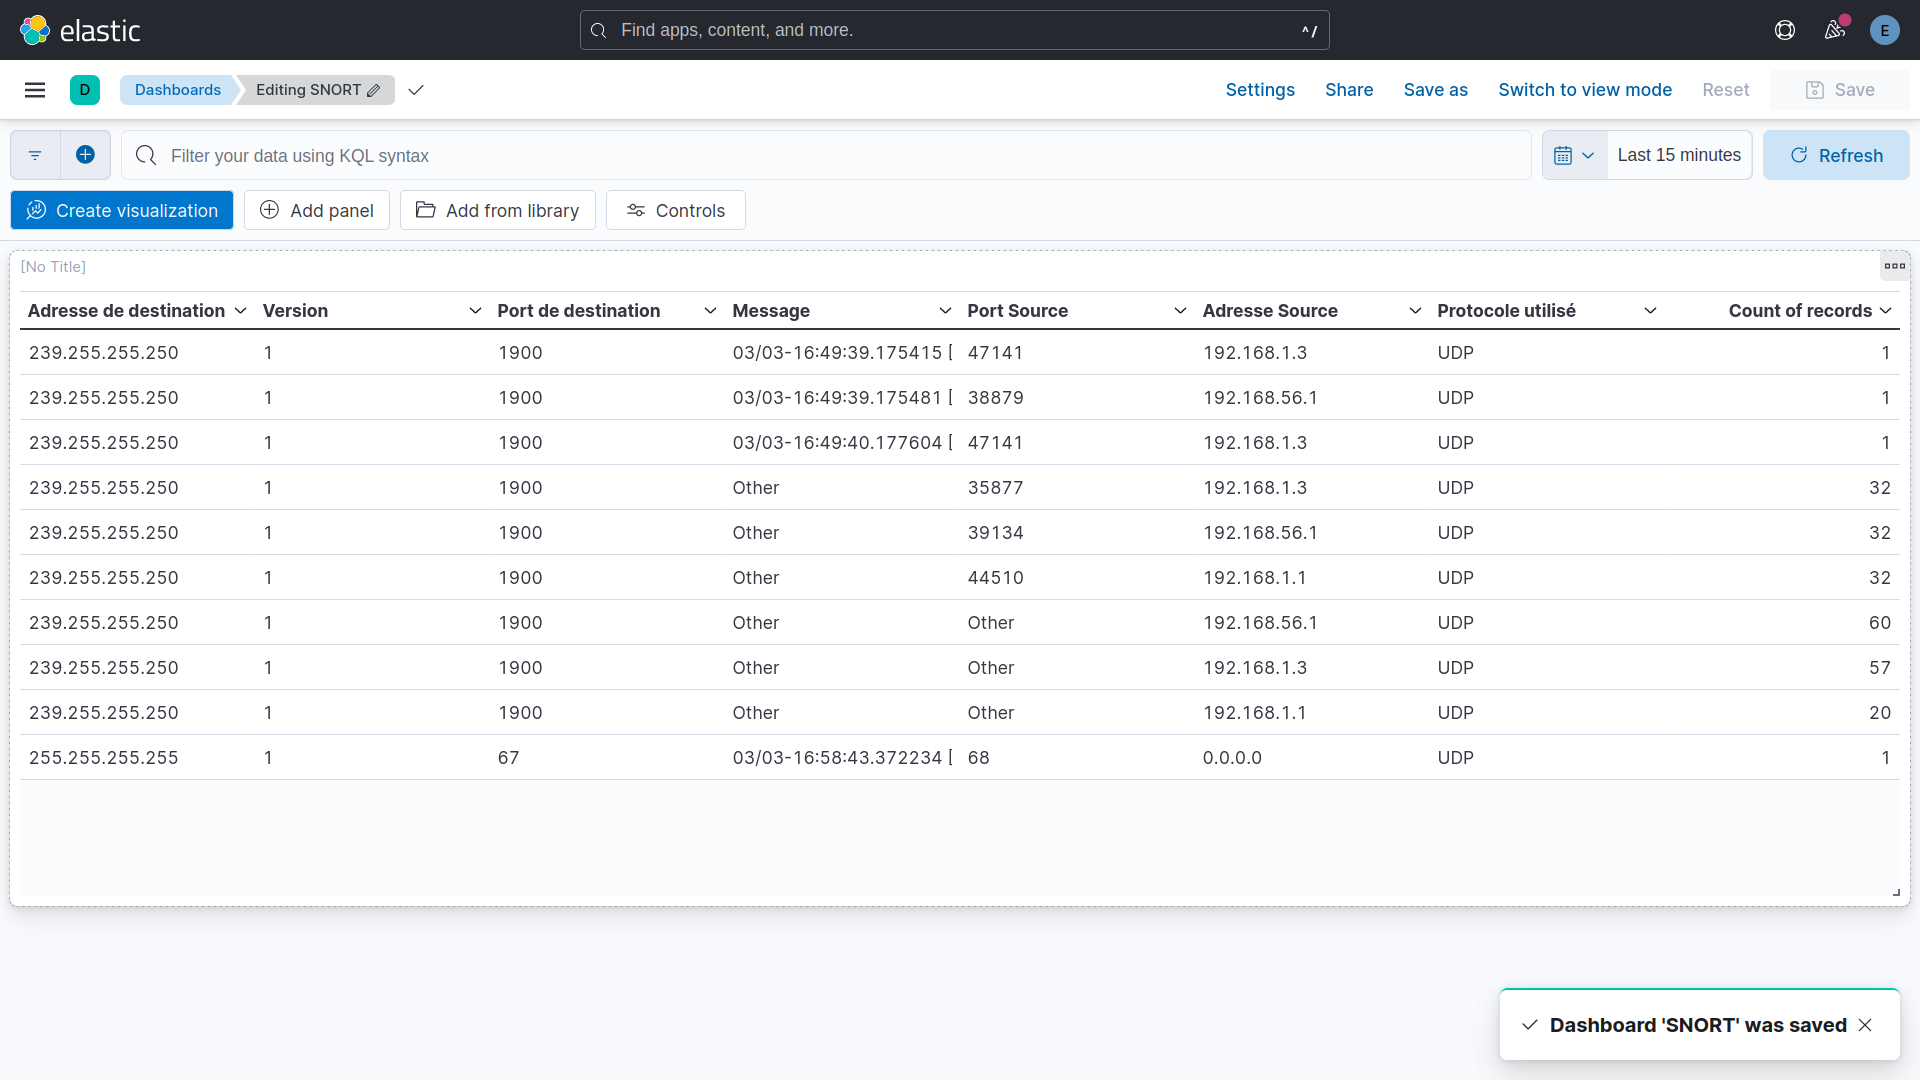
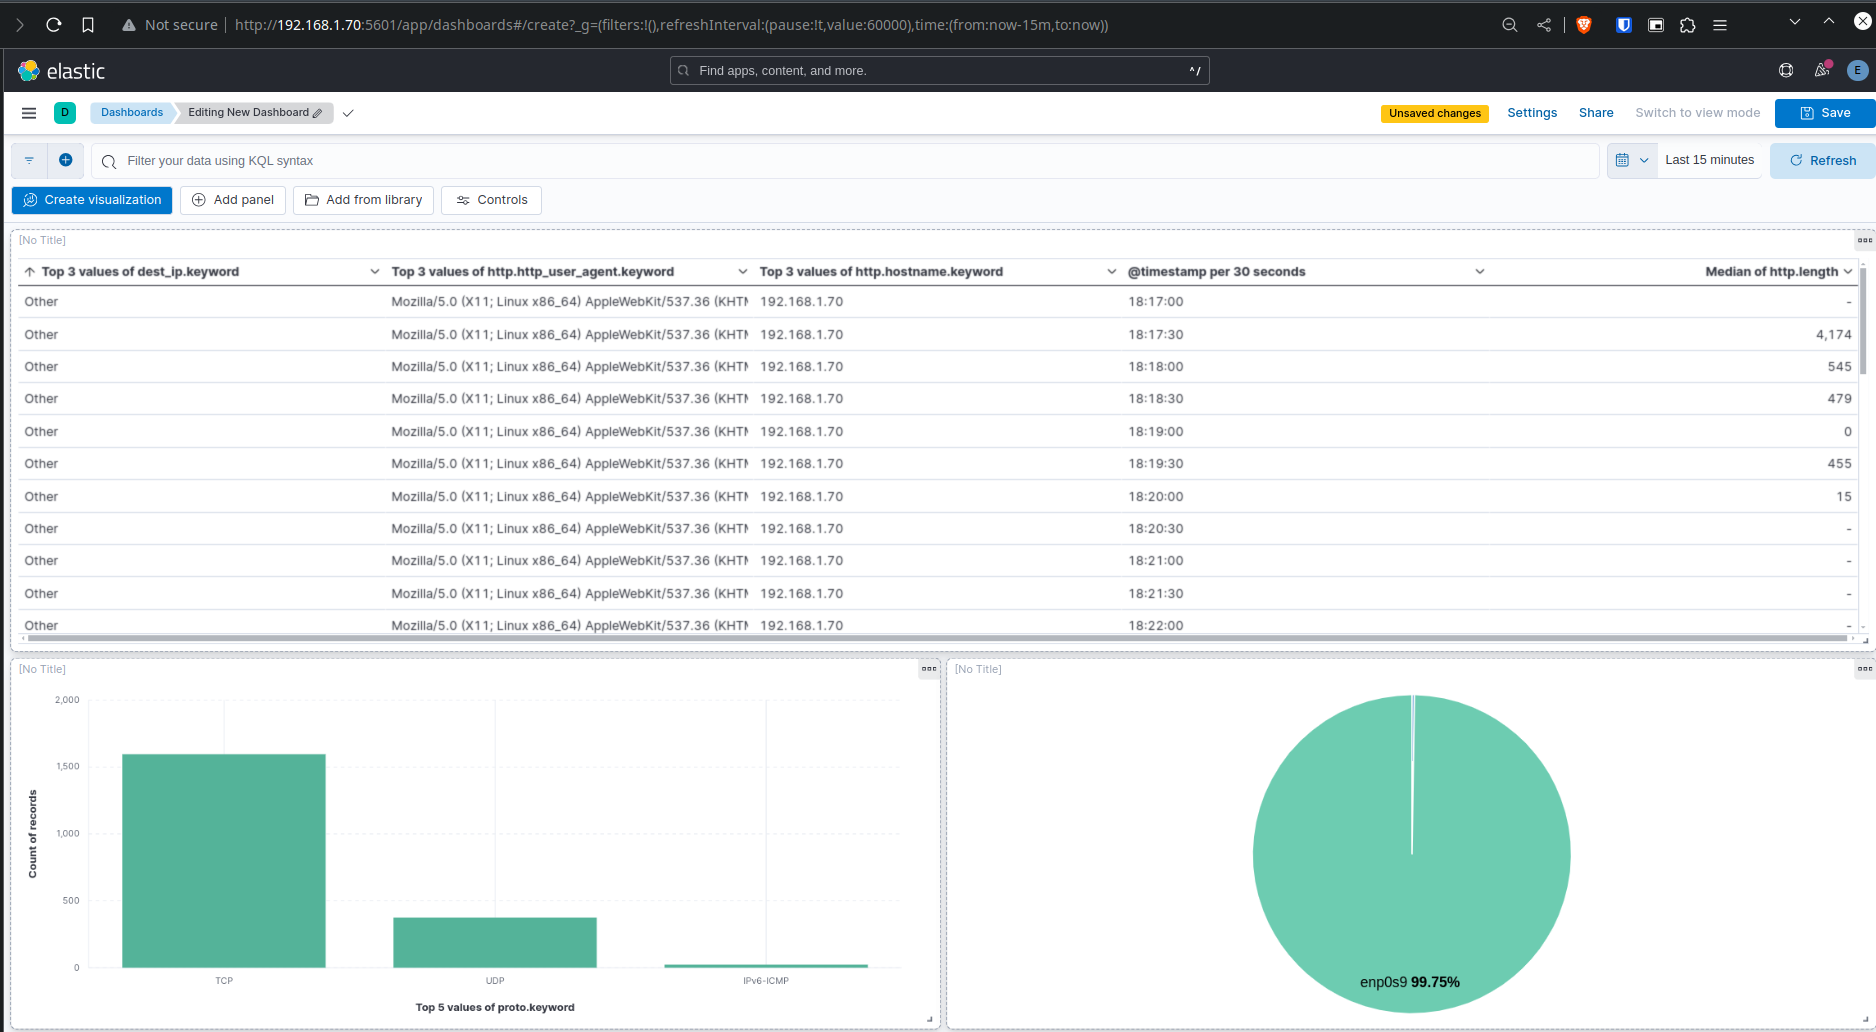
On a une vue d’ensemble des communications réseau : répartition par interface, utilisation des protocoles TCP/UDP, et un tableau des user agents avec leurs IPs associées.
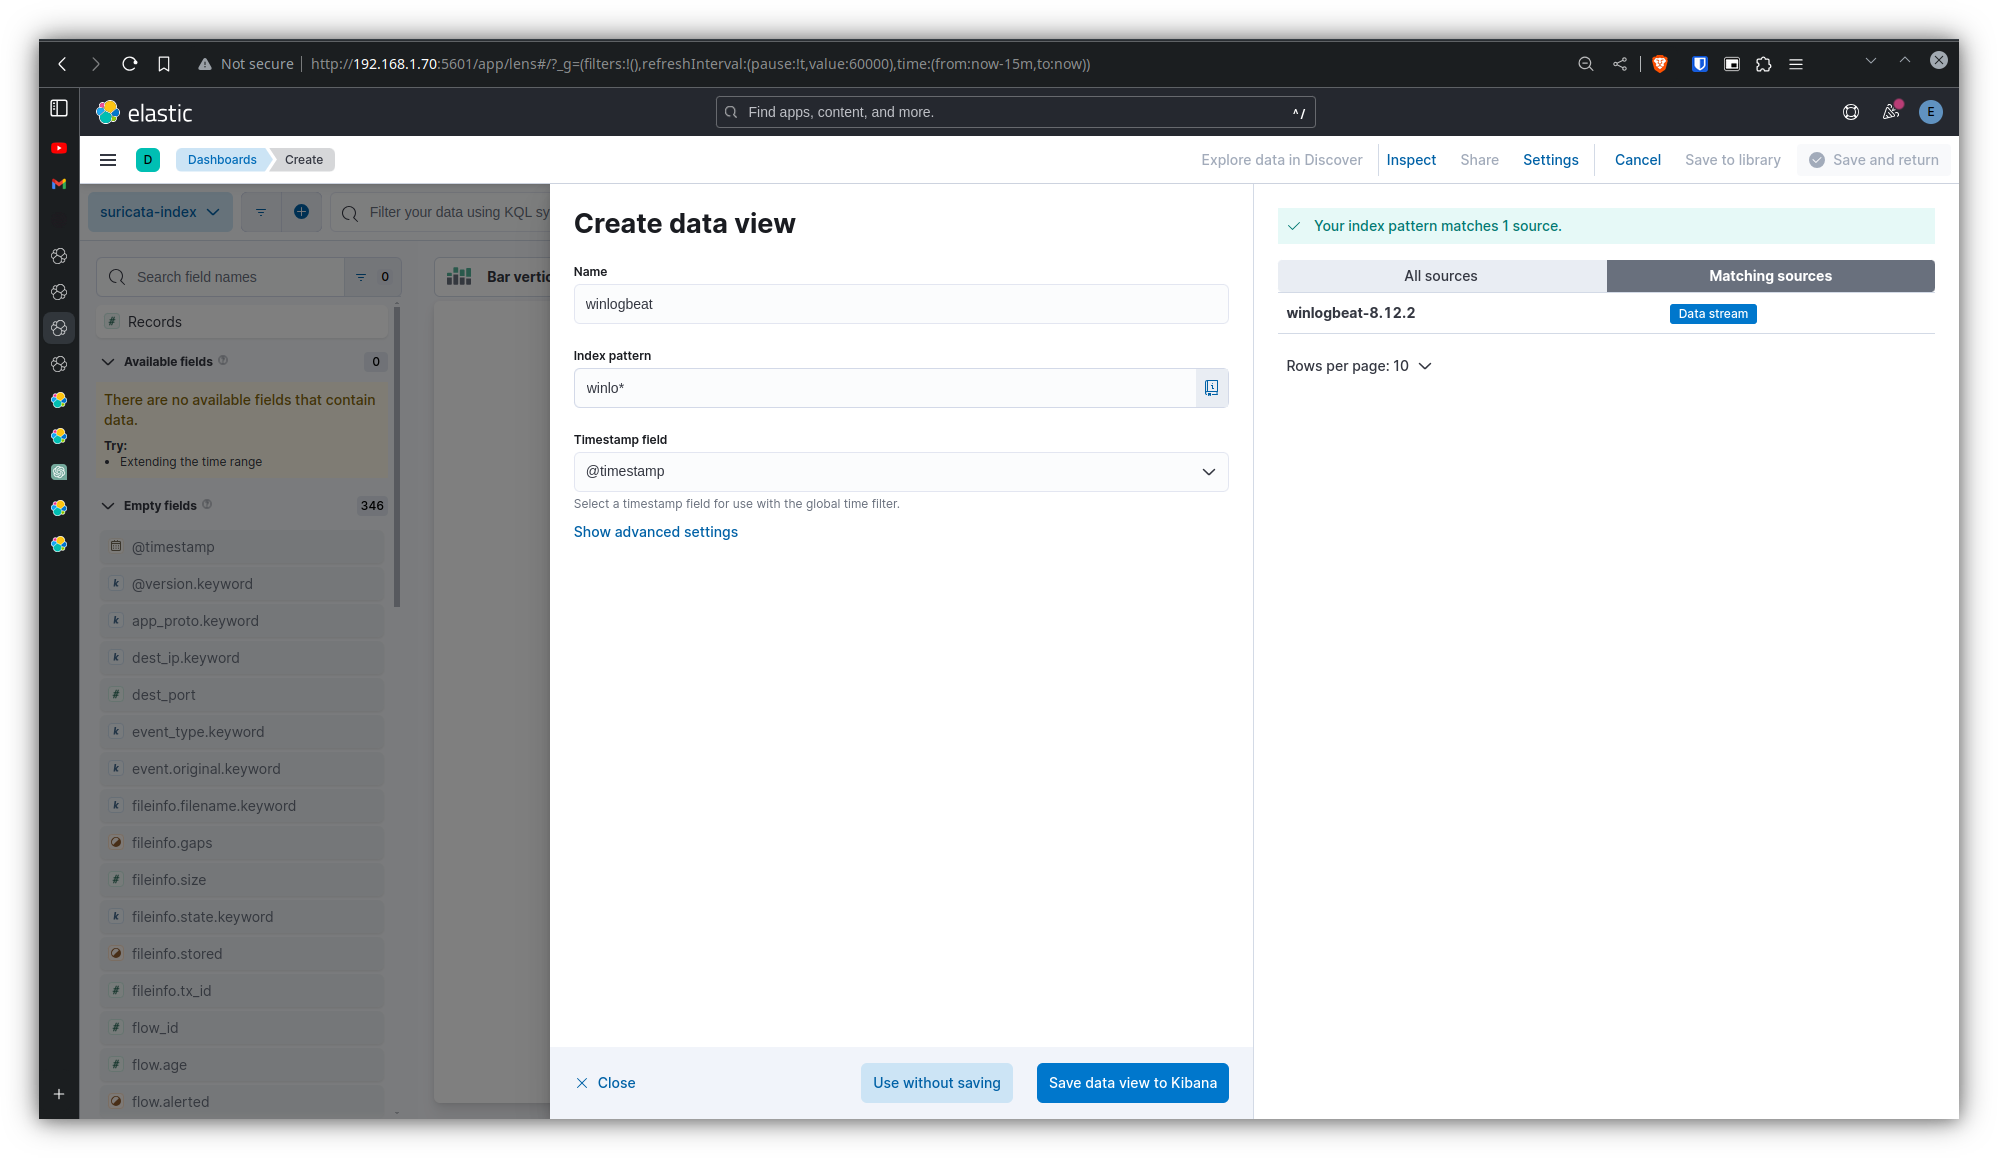
Pour récupérer les logs d’une machine Windows, on utilise Winlogbeat — un agent léger de la suite Elastic qui capture les événements Windows en temps réel et les envoie directement vers Elasticsearch.
La configuration :
setup.template.name: "winlogbeat"setup.template.pattern: "winlogbeat-*"
winlogbeat.event_logs:  - name: Application    ignore_older: 72h  - name: System  - name: Security  - name: Microsoft-Windows-Sysmon/Operational  - name: Windows PowerShell    event_id: 400, 403, 600, 800  - name: Microsoft-Windows-PowerShell/Operational    event_id: 4103, 4104, 4105, 4106  - name: ForwardedEvents    tags: [forwarded]
setup.template.settings:  index.number_of_shards: 1
setup.kibana:  hosts: ["localhost:5601"]
output.elasticsearch:  index: "winlogbeat-%{[agent.version]}-%{+yyyy.MM.dd}"  hosts: ["192.168.1.70:9200"]  protocol: "https"  username: "elastic"  password: "maybe_secure_password_here ?!"  ssl.certificate_authorities: ["C:\\Users\\vagrant\\Downloads\\winlogbeat-8.12.2-windows-x86_64\\ca.cert"]
processors:  - add_host_metadata:      when.not.contains.tags: forwarded  - add_cloud_metadata: ~
On couvre les logs Application, System, Security, Sysmon et PowerShell. On lance Winlogbeat depuis un terminal Windows :
./winlogbeat.exe -c winlogbeat.yml -e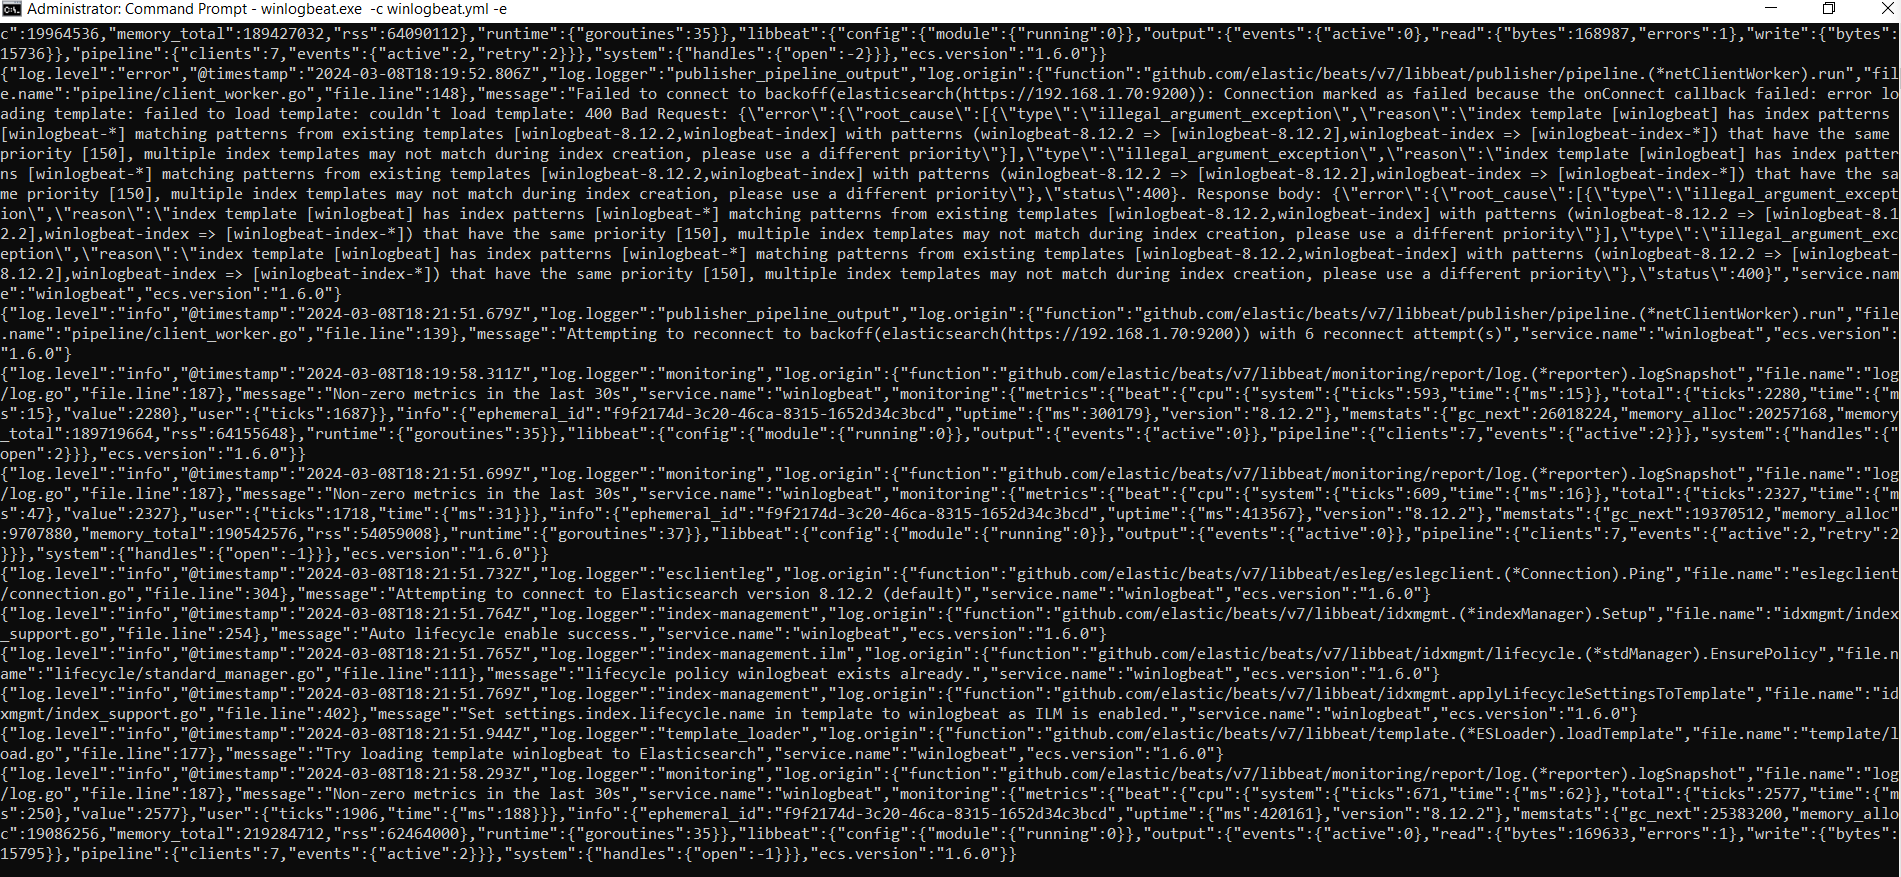
Les logs remontent bien dans Elasticsearch :
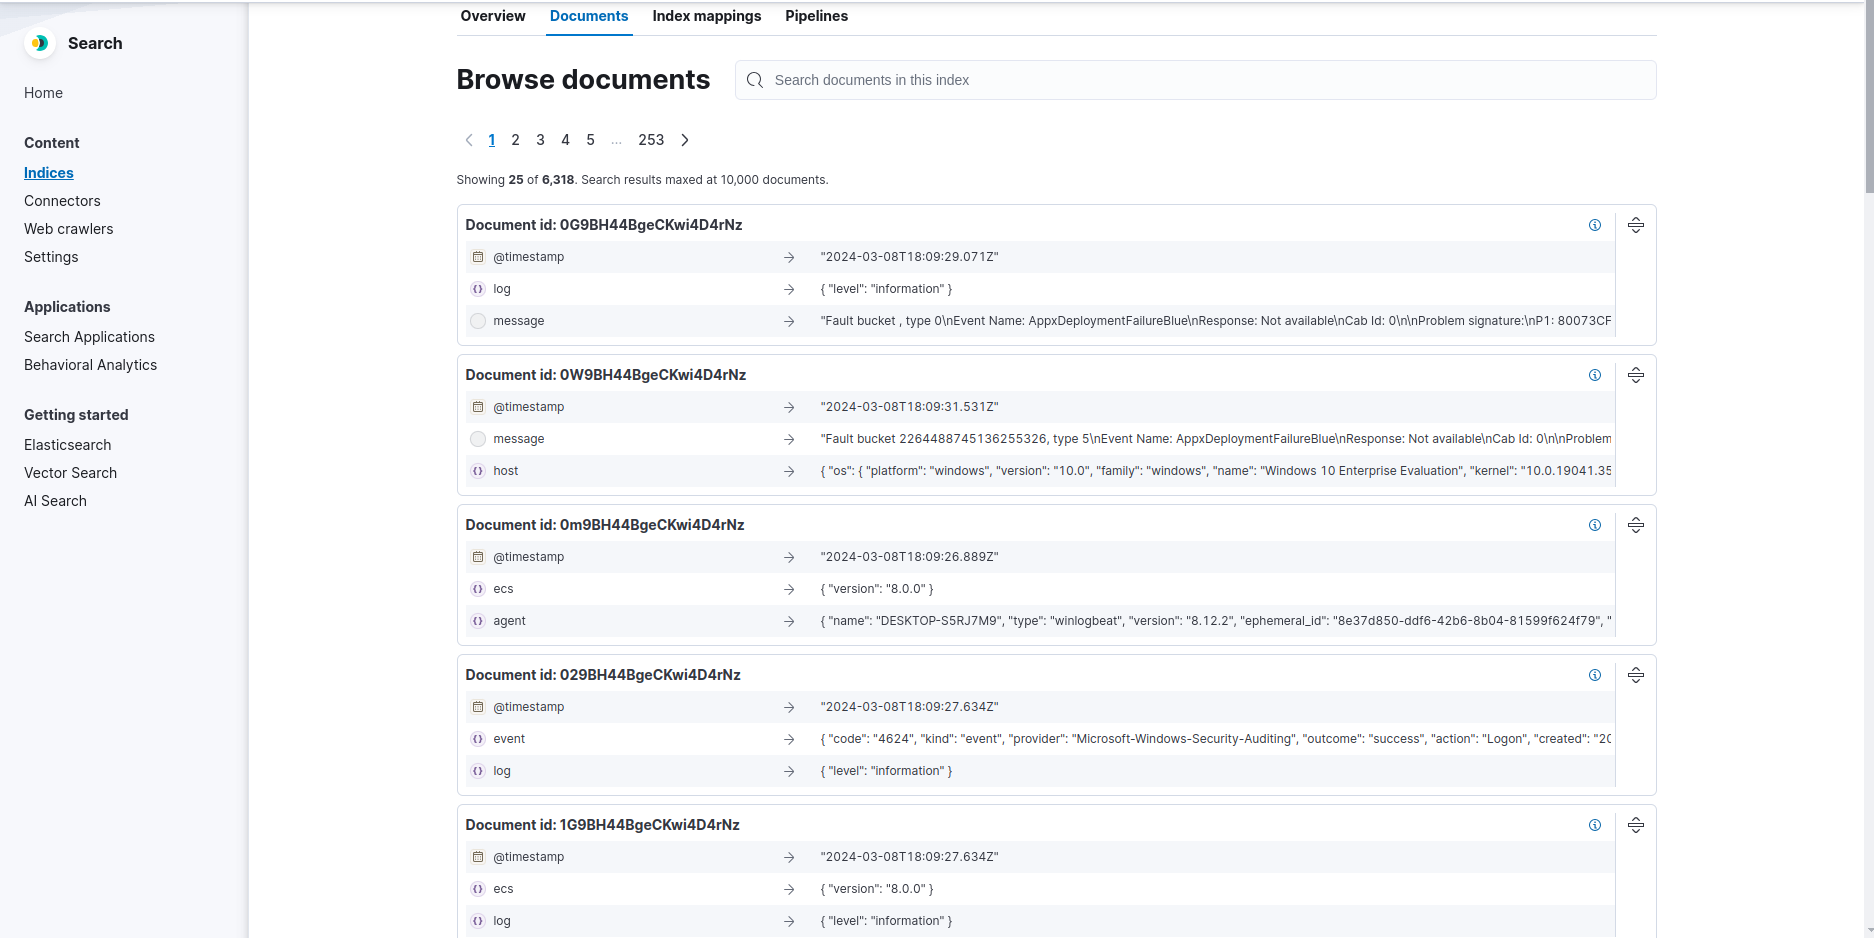
On configure la source de données dans Kibana pour créer les visualisations :
À ce stade, on a une stack ELK complète qui centralise les logs de Snort, Suricata et d’une machine Windows. C’est une base solide pour aller plus loin — corrélation d’événements, alerting, ou intégration de nouvelles sources.